This topic contains a solution. Click here to go to the answer
|
|
|

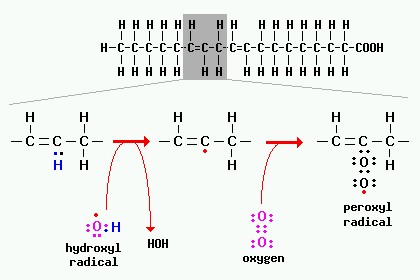 A peroxidation reaction involving a fatty acid is depicted in the figure below.
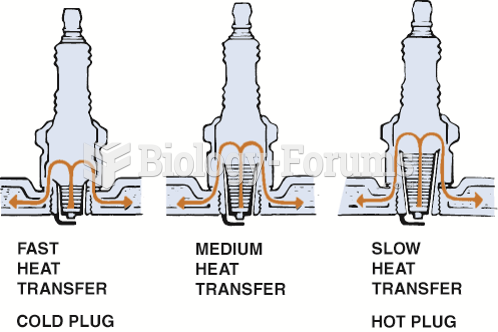 The heat range of a spark plug is determined by the distance the heat has to flow from the tip to ...
 How to solve a linear algebraic mixture problem with two unknowns
 How to perform linear approximations in calculus
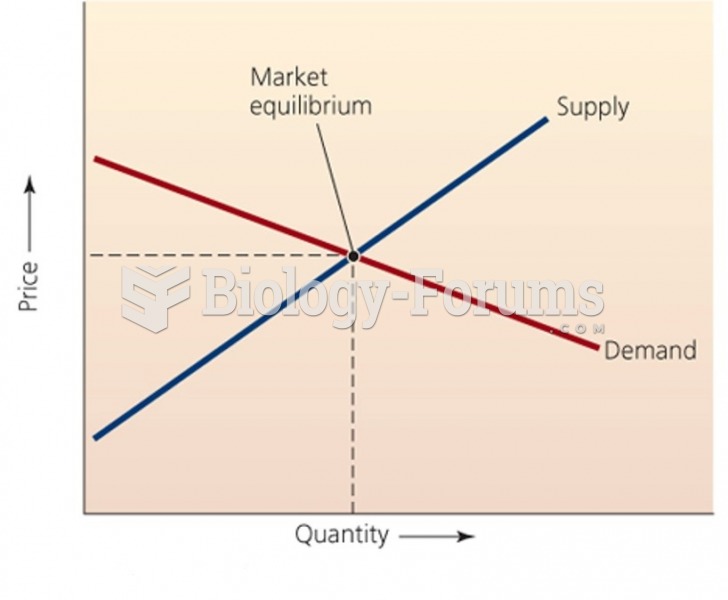 Classic Supply - Demand Curve
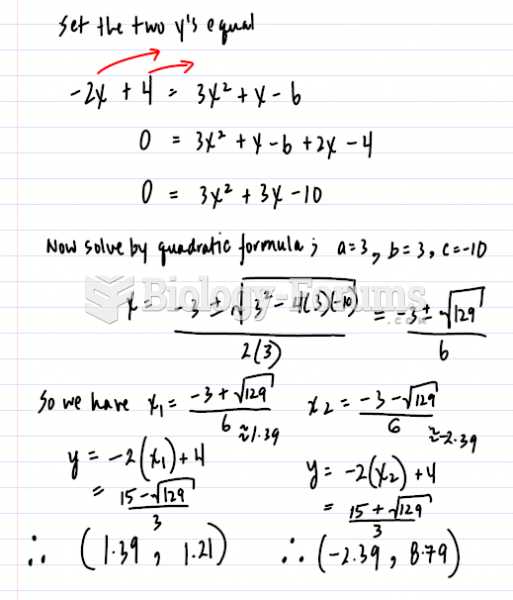 Solution to linear and parabola