This topic contains a solution. Click here to go to the answer
|
|
|

 Cheetah at the Werribee Open Range Zoo
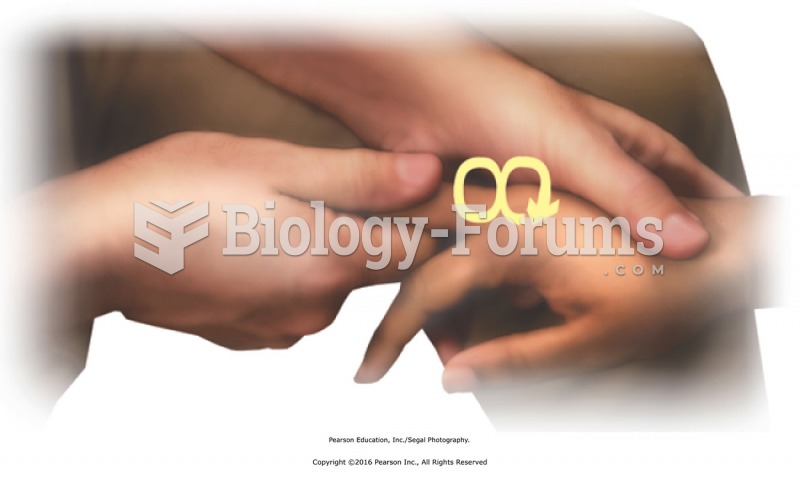 Move joints in hands. Apply scissoring to metacarpals and figure-8s to fingers.
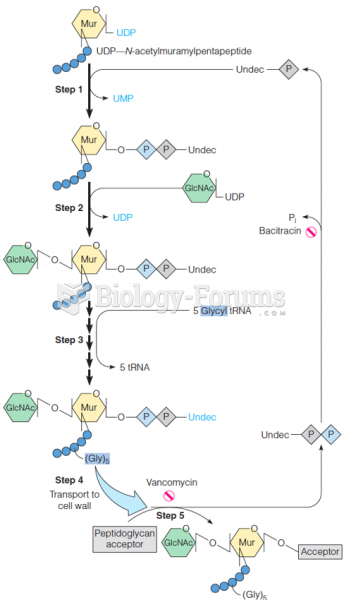 Synthesis of the linear peptidoglycan molecule of S. aureus
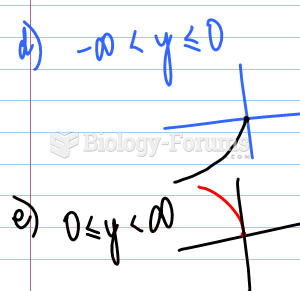
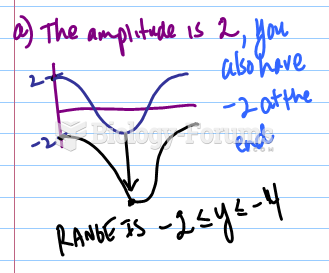 Range for Functions
 Range for Functions
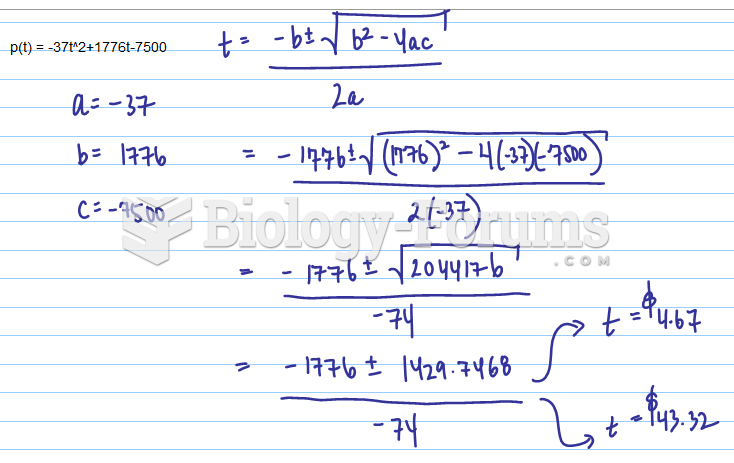 The profit, p(t), made at a fair depends on the price of the ticket, t. The profit is modelled ...