This topic contains a solution. Click here to go to the answer
|
|
|

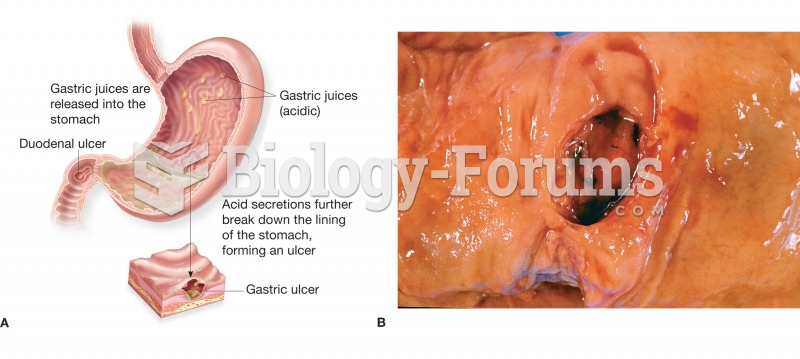 (A) Figure illustrating the location and appearance of a peptic ulcer in both the stomach and the du
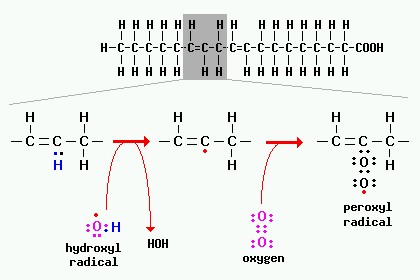 A peroxidation reaction involving a fatty acid is depicted in the figure below.
 Figure of a Woman with a Drawing Showing Evidence of Original Painting and Outlining Design Scheme
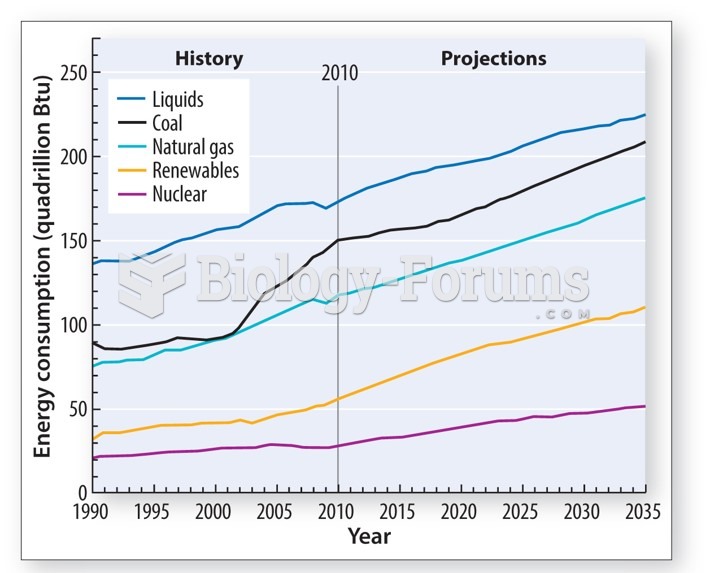 The growth in demand for energy use is met by burning fossil fuels
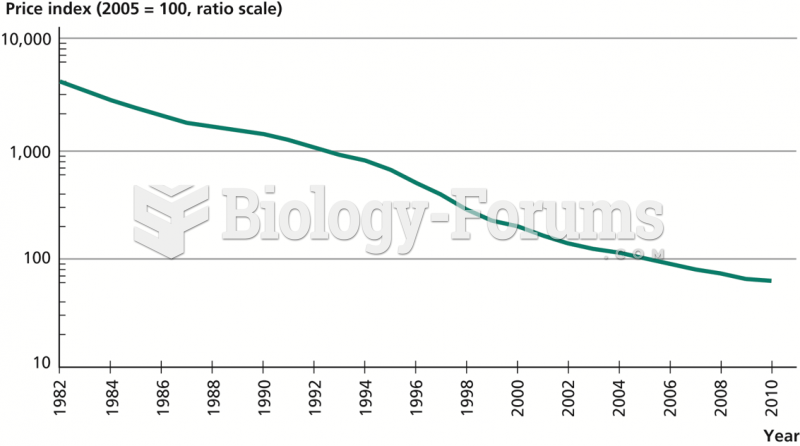 Price of Computers, 1982–2010
 Find the factor demand for labour and the amount of output it will produce. Show all ...