This topic contains a solution. Click here to go to the answer
|
|
|

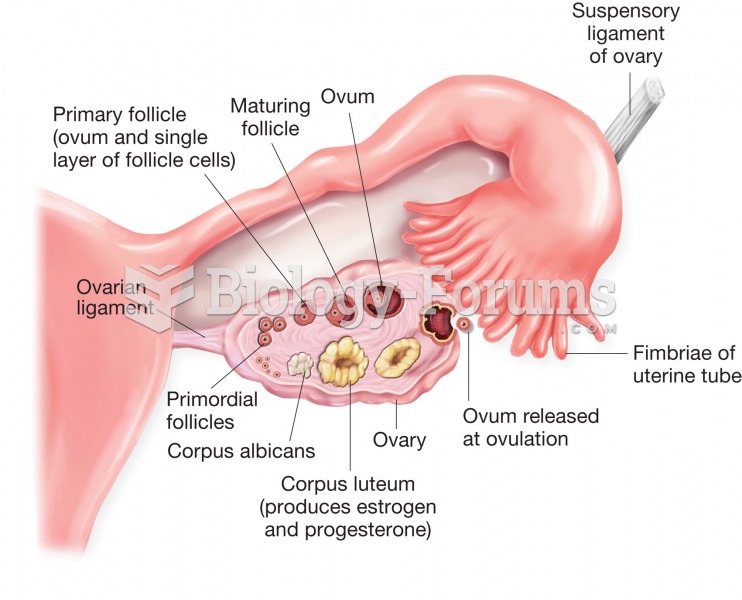 Structure of the ovary and uterine (fallopian) tube. Figure illustrates stages of ovum development a
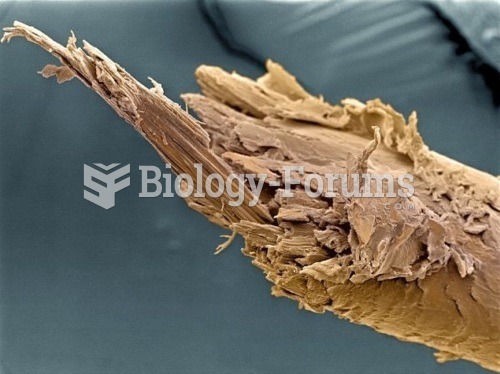 Human Hair
 Human Heart Cir
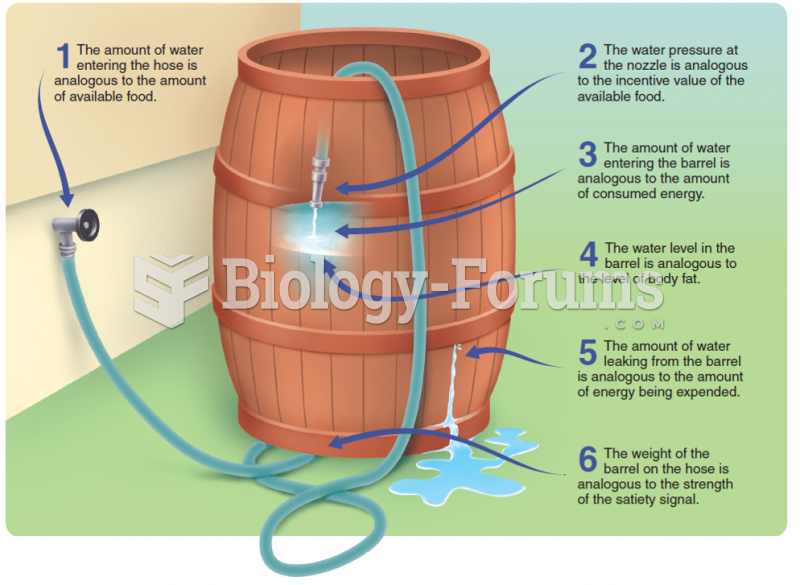 The leaky-barrel model: a settling-point model of eating and body weight homeostasis.
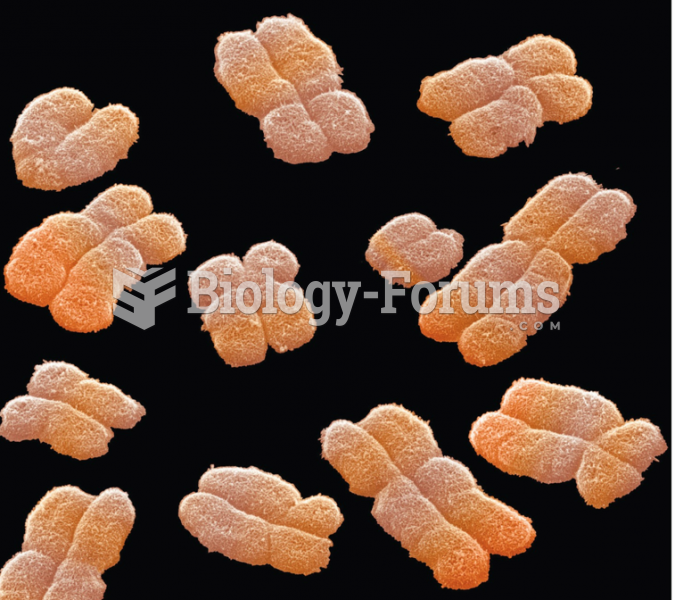 Replicated human chromosomes as seen by scanning electron microscopy
 Bayesian Analysis of the Genotype of II-2 in Figure A.4