This topic contains a solution. Click here to go to the answer
|
|
|

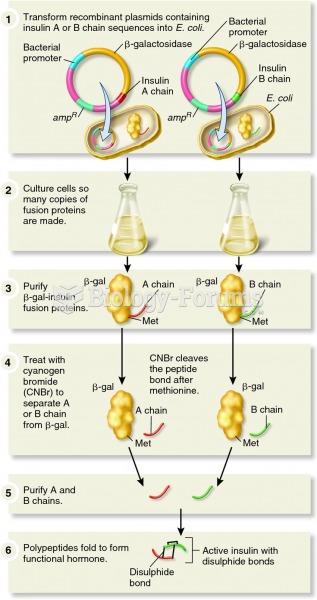 The use of bacteria to make human insulin
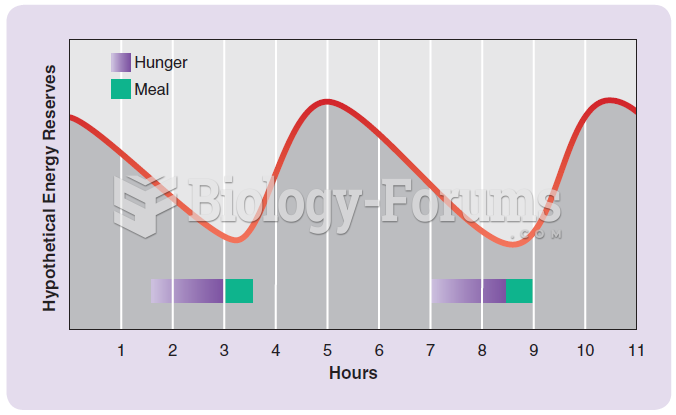 The energy set-point view that is the basis of many people’s thinking about hunger and eating.
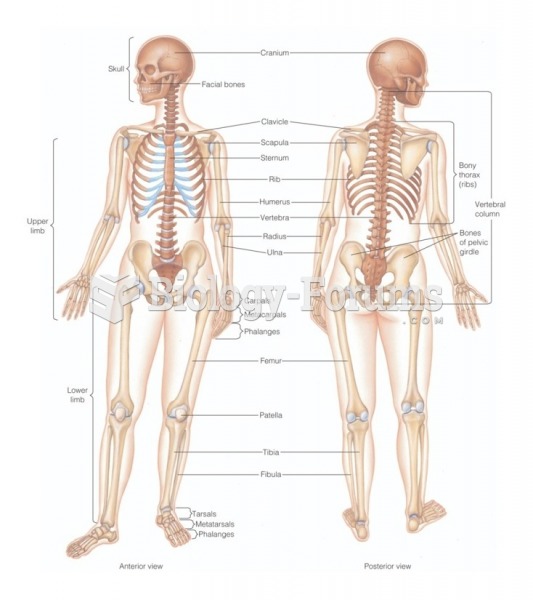 Bones of the human skeleton
 Opener A colorized cross section of the human brain
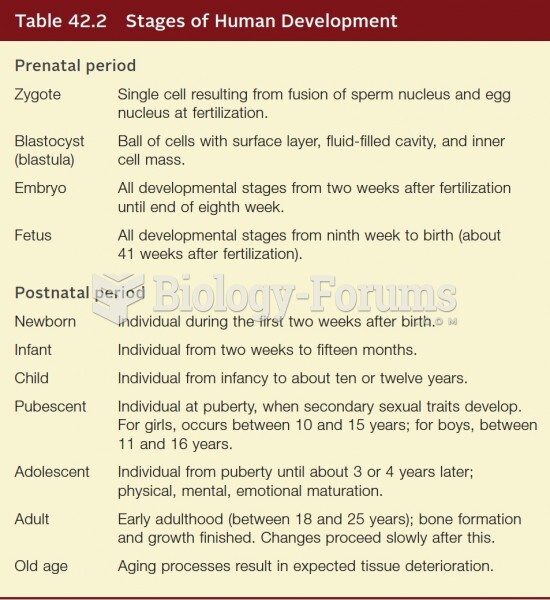 Stages of Human Development
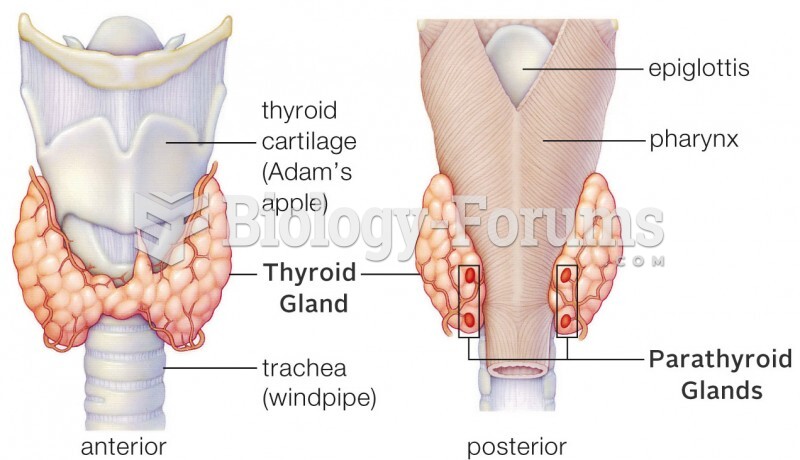 Human Thyroid and Parathyroid Glands