This topic contains a solution. Click here to go to the answer
|
|
|

 Mouse with human liver cells
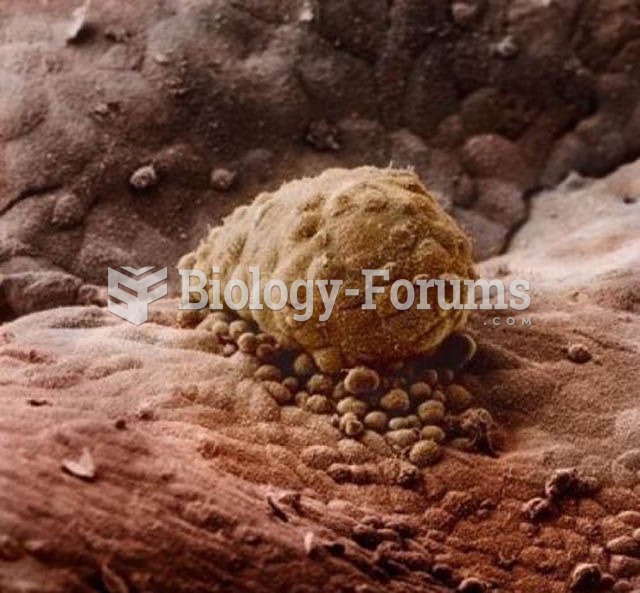 The human embryo
 Demonstrate the Application of Triangular, Figure-Eight, and Tubular Bandages
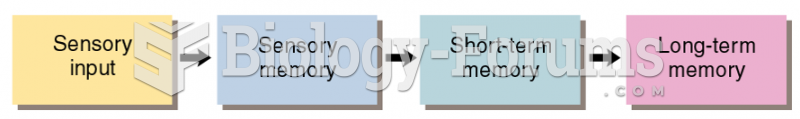 A Simplified Model of Information Flow in Human Memory
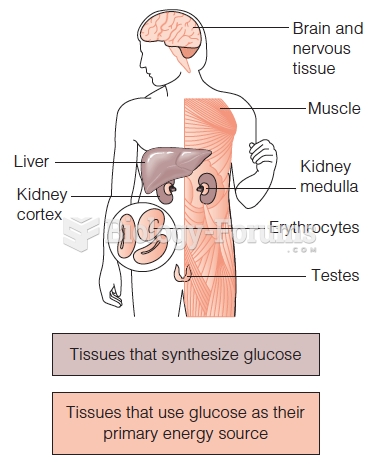 Synthesis and use of glucose in the human body
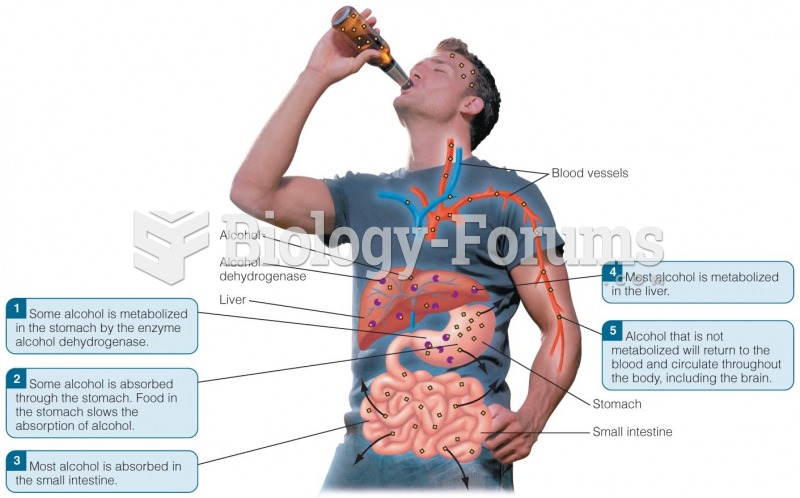 The Metabolism of Alcohol in the Human Body