|
|
|

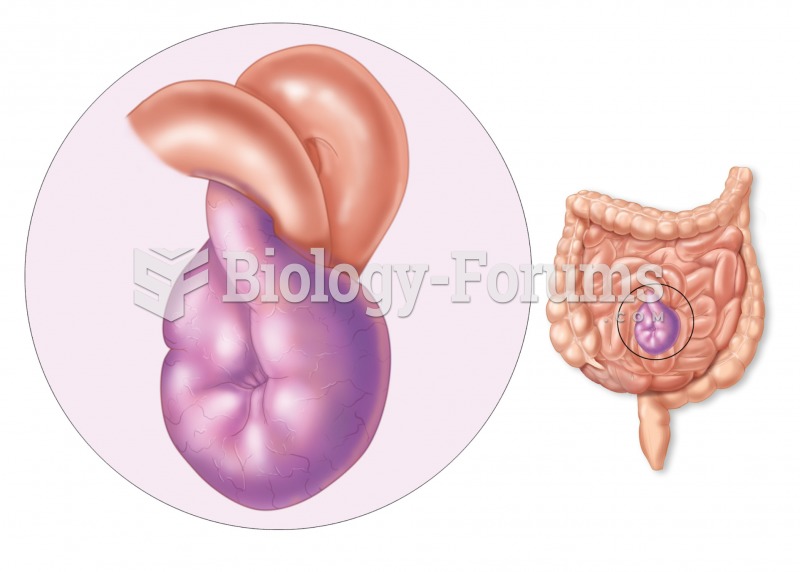 Volvulus. A volvulus results when the small intestine twists, causing an obstruction that can lead t
 Louis Comfort Tiffany, Tiffany Studios, Water-lily table lamp.
 A Hall-effect sensor produces a digital on-off voltage signal whether it is used with a blade or a ...
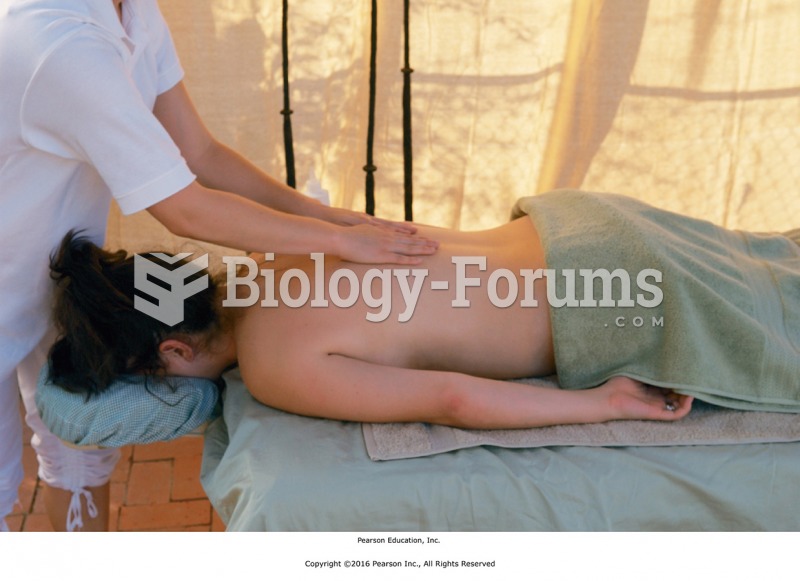 Using small, circular strokes, exfoliate the client’s neck and back.
 How to create a table of values displaying commission and earnings (Question 2)
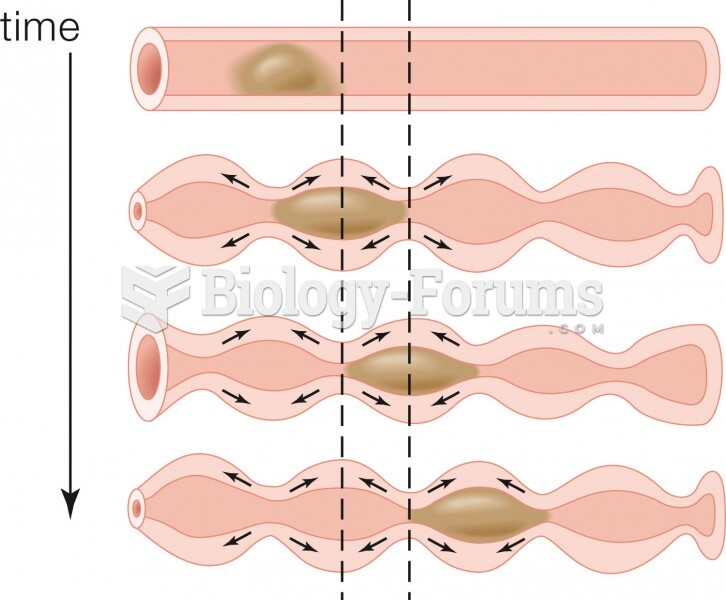 Muscle action in the small intestine