|
|
|

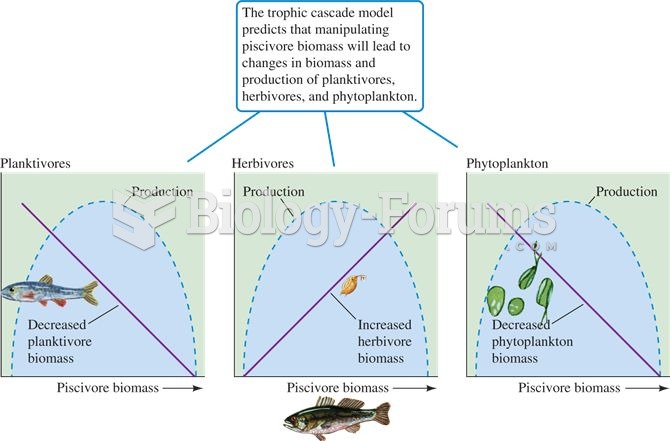 Predicted effects of piscivores on planktivore, herbivore, and phytoplankton biomass and production
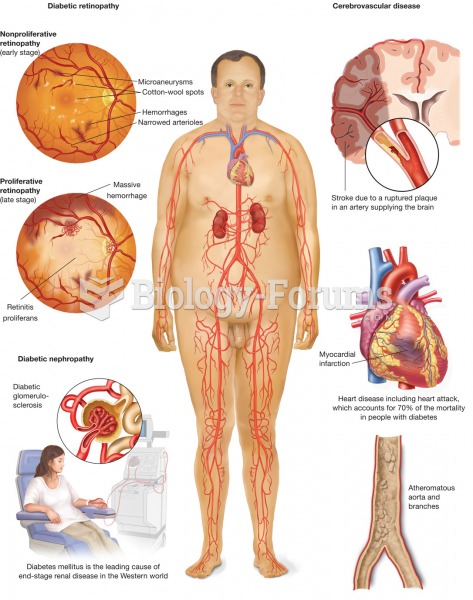 Diabetes mellitus. The metabolic disease diabetes mellitus, with symptoms of polydipsia, polyuria, a
 Rhizopus nigricans- black bread mold.
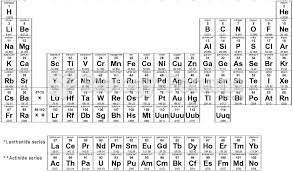 Periodic Table
 Perform horizontal stroking of the thigh by facing the table and placing hands on the thigh with ...
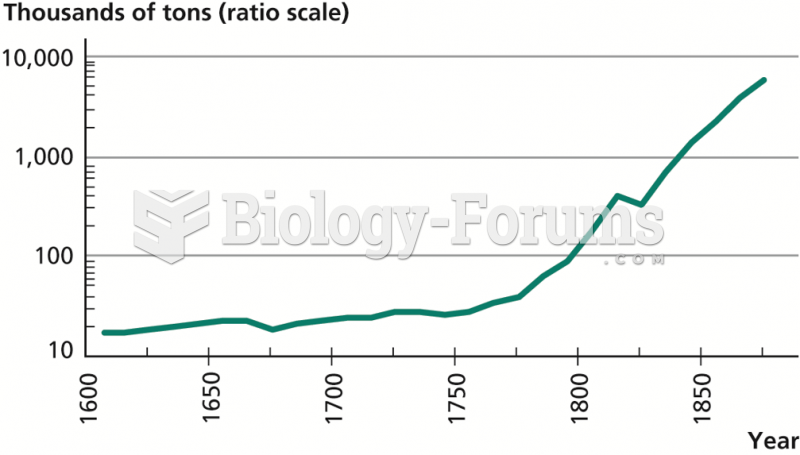 British Iron Production, 1600–1870