|
|
|

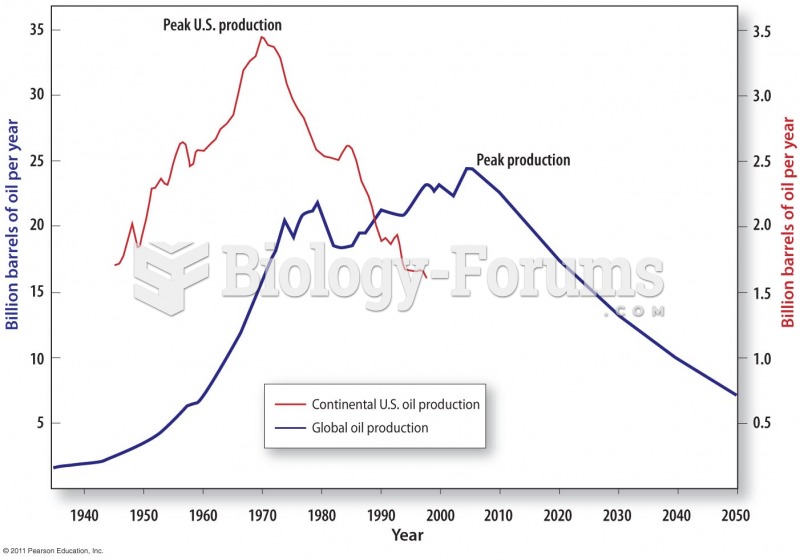 An Estimate of the Time of Global Peak Conventional Oil Production
 Small Town USA: Struggling to Survive
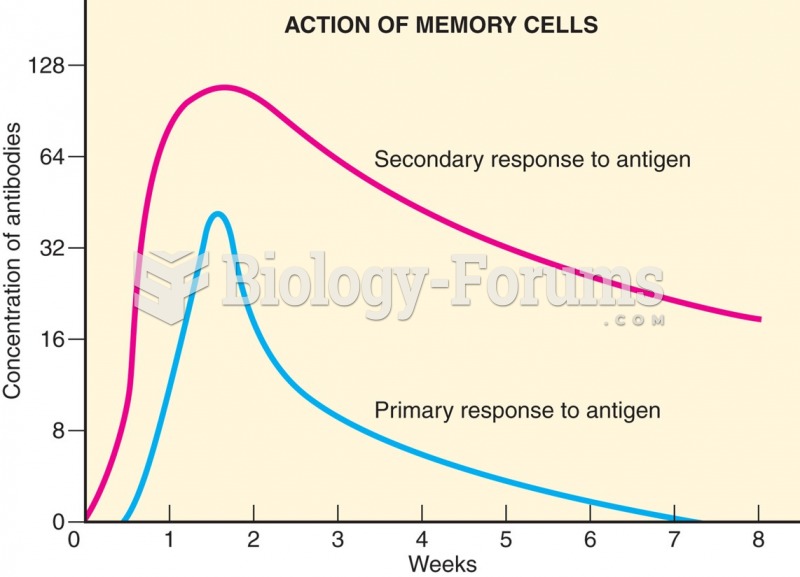 Secondary response begins more rapidly after exposure to antigen, produces more antibodies, and ...
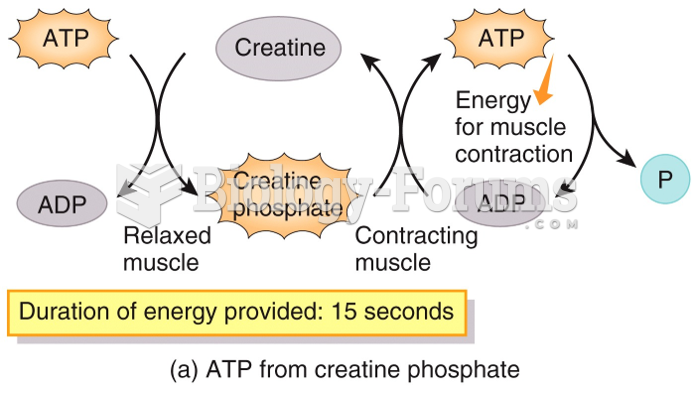 Production of ATP in Skeletal Muscle
 I Am The Bread of Life Suzanne Toolan with Lyrics Catholic Hymn Song Sunday 7pm Choir
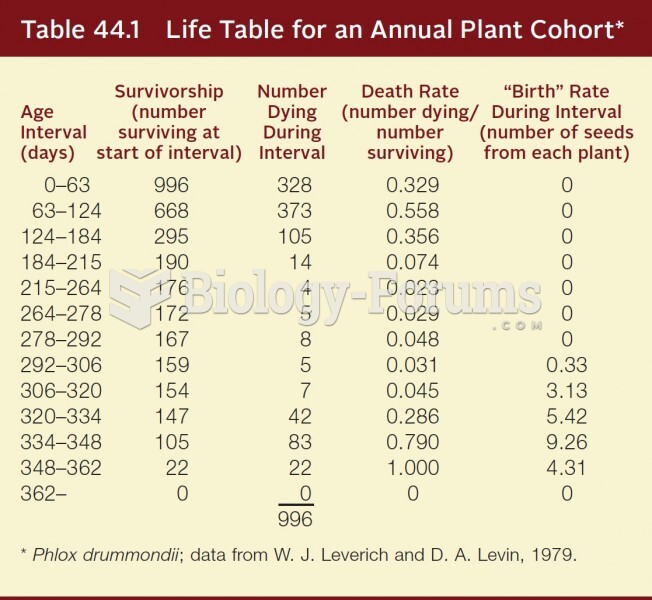 Life Table for an Annual Plant Cohort