|
|
|

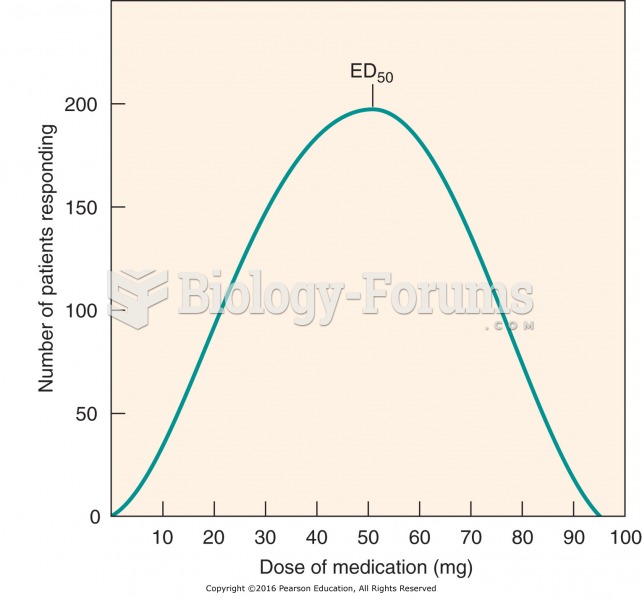 Frequency distribution curve: interpatient variability in drug response.
 Figure-8s on the toes mobilize joints of the foot.
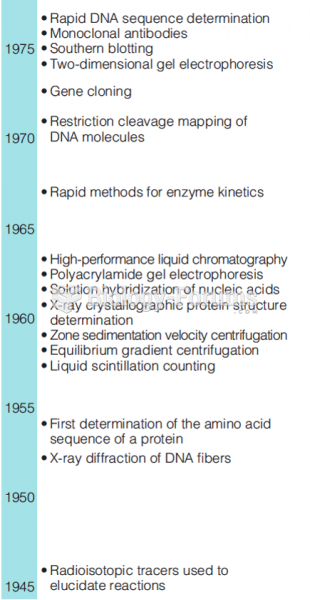 Recent history of biochemistry shown by the introduction of new techniques. (part 1)
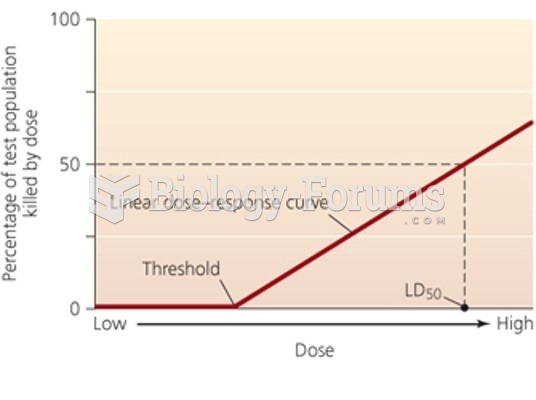 Dose-response curve with threshold
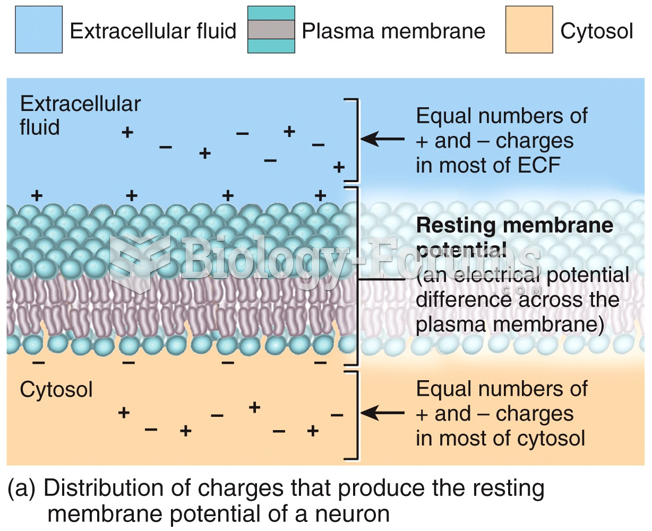 Resting Membrane Potential: Voltage Difference
 At what speed does Grogzetti need to take the curve to avoid sliding?