|
|
|
Allergies play a major part in the health of children. The most prevalent childhood allergies are milk, egg, soy, wheat, peanuts, tree nuts, and seafood.
There are more nerve cells in one human brain than there are stars in the Milky Way.
Throughout history, plants containing cardiac steroids have been used as heart drugs and as poisons (e.g., in arrows used in combat), emetics, and diuretics.
Anesthesia awareness is a potentially disturbing adverse effect wherein patients who have been paralyzed with muscle relaxants may awaken. They may be aware of their surroundings but unable to communicate or move. Neurologic monitoring equipment that helps to more closely check the patient's anesthesia stages is now available to avoid the occurrence of anesthesia awareness.
The most dangerous mercury compound, dimethyl mercury, is so toxic that even a few microliters spilled on the skin can cause death. Mercury has been shown to accumulate in higher amounts in the following types of fish than other types: swordfish, shark, mackerel, tilefish, crab, and tuna.
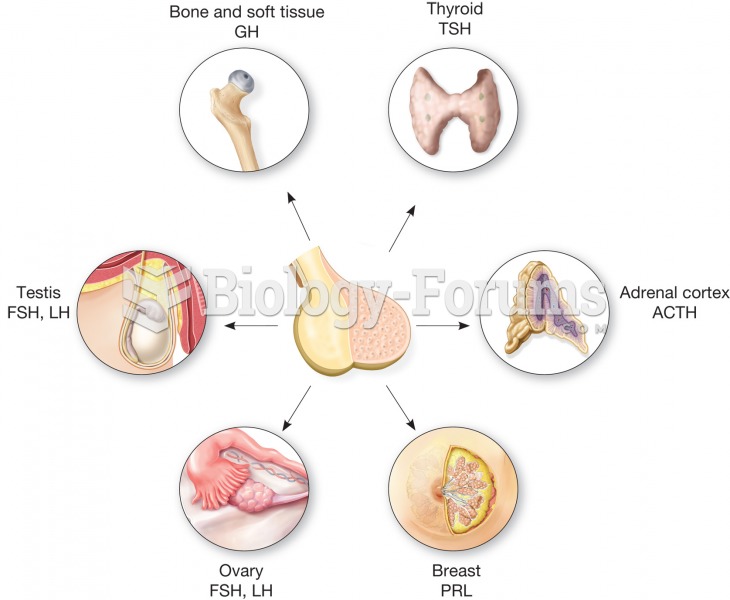
 The anterior pituitary is sometimes called the master gland because it secretes many hormones that r
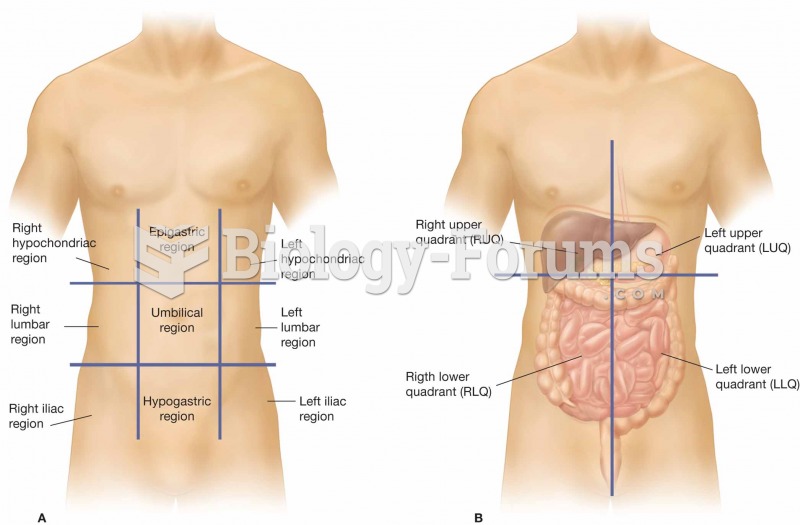
 (A) The nine regions of the abdominopelvic cavity. (B) The four regions of the abdomen, which are re


