Which of the following could have led to the shifts illustrated in the figure above?
i. The U.S. exchange rate was expected to depreciate between 2001 and 2009.
ii. The U.S. exchange rate was expected to appreciate between 2001 and 2009.
iii. The U.S. interest rate rose relative to interest rates in other countries between 2001 and 2009.
A) i only B) ii only C) iii only D) i and iii E) ii and iii
Question 2
In the figure below, label the axes and then draw a demand for money curve. Illustrate an increase in the demand for money.
What will be an ideal response?

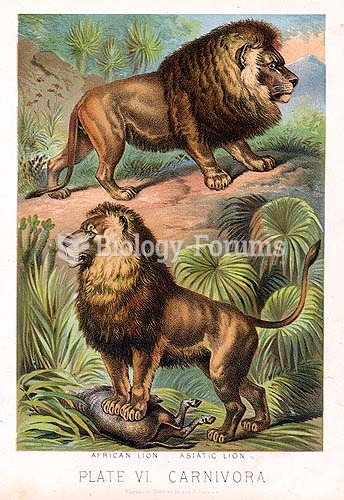 African (above) and Asiatic (below) lions, as illustrated in Johnsons Book of Nature
 Demonstrate the Application of Triangular, Figure-Eight, and Tubular Bandages
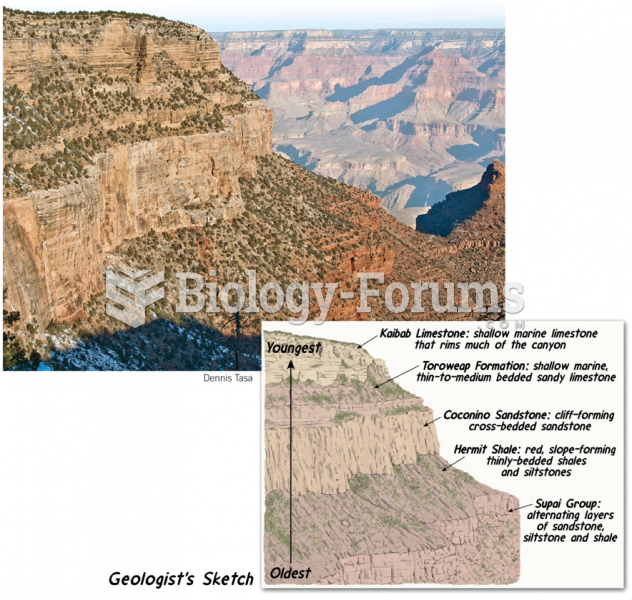 Superposition Is Well Illustrated in the Grand Canyon
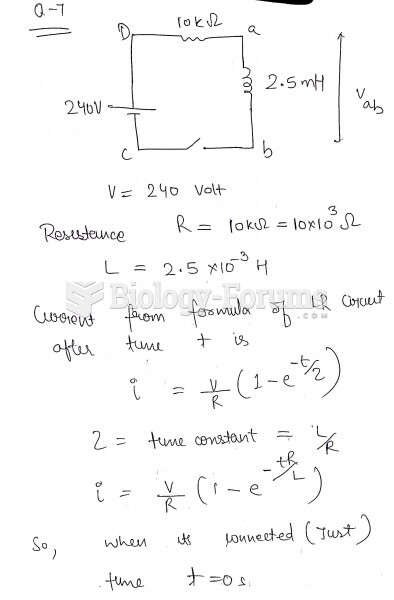 The figure shows an LR circuit with a switch and a 240-volt battery. At the instant the switch ...
 What is the current in Figure 16-1(b) if the diode is made of silicon and the polarity of the ...