Which of the following could have led to the shifts illustrated in the figure above?
i. The U.S. exchange rate was expected to depreciate between 2001 and 2009.
ii. The U.S. exchange rate was expected to appreciate between 2001 and 2009.
iii. The U.S. interest rate rose relative to interest rates in other countries between 2001 and 2009.
A) i only B) ii only C) iii only D) i and iii E) ii and iii
Question 2
In the figure below, label the axes and then draw a demand for money curve. Illustrate an increase in the demand for money.
What will be an ideal response?

 front muscle figure
 Paul Colin, Figure of a Woman.
 Demonstrate the Application of Triangular, Figure-Eight, and Tubular Bandages
 Continuum of aggression. Based on an unpublished figure by Joanne DeSanto Iennaco.
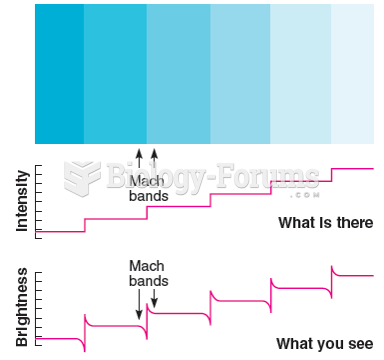 The illusory bands visible in this figure are often called Mach bands, although Mach used a ...
 For the circuit in Figure 1, assume ideal diodes. The peak inverse voltage is approximately