This topic contains a solution. Click here to go to the answer
|
|
|

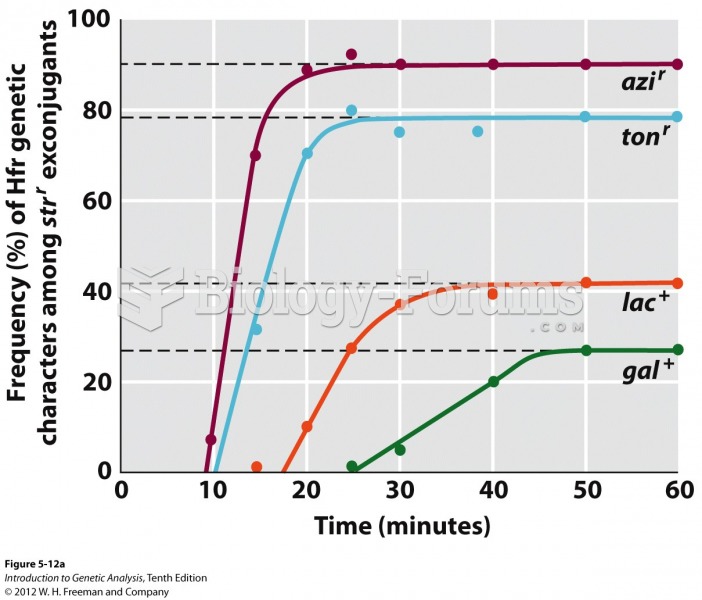 Tracking time of marker entry generates a chromosome map
 Meal Time
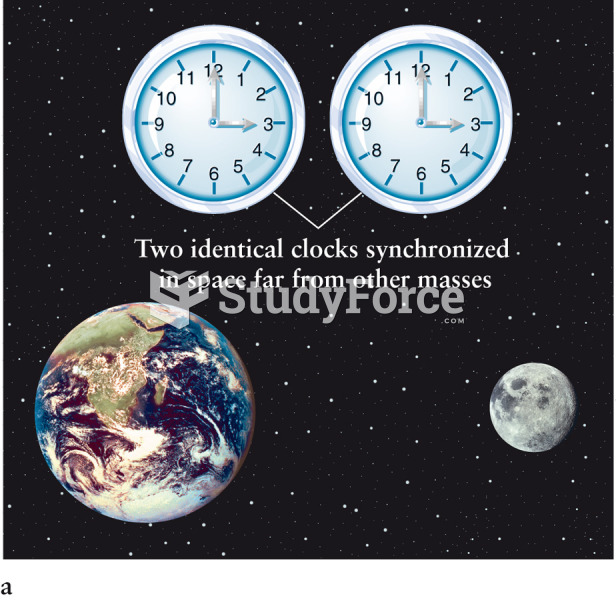 Time Slows Down Near Matter
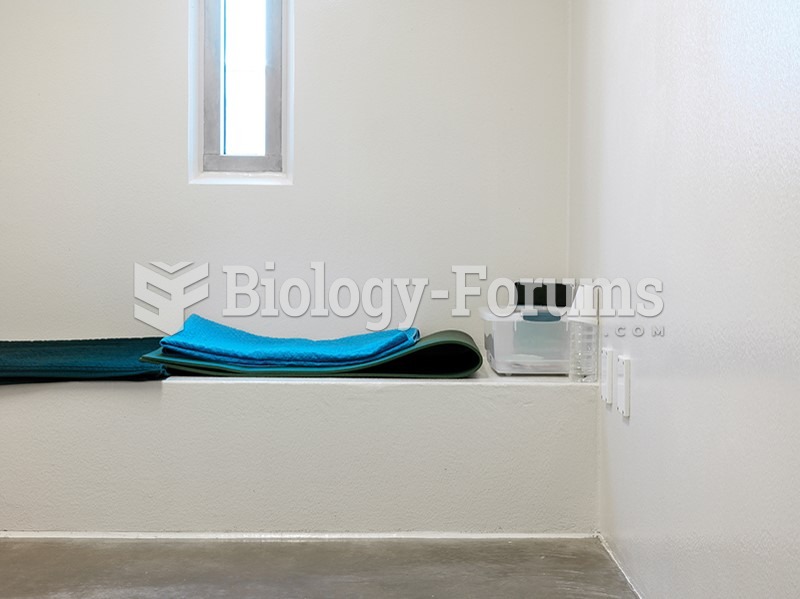 Edmund Clark. Camp Five, Detainee's Cell, from the series Guantanamo: If the Light Goes Out, ...
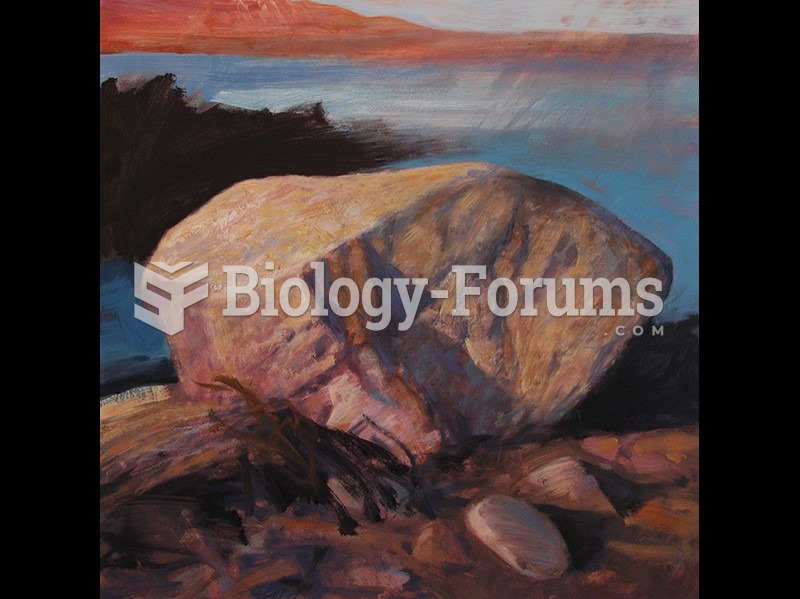 Don Gray, Stone #2, from the series Nine Stones.
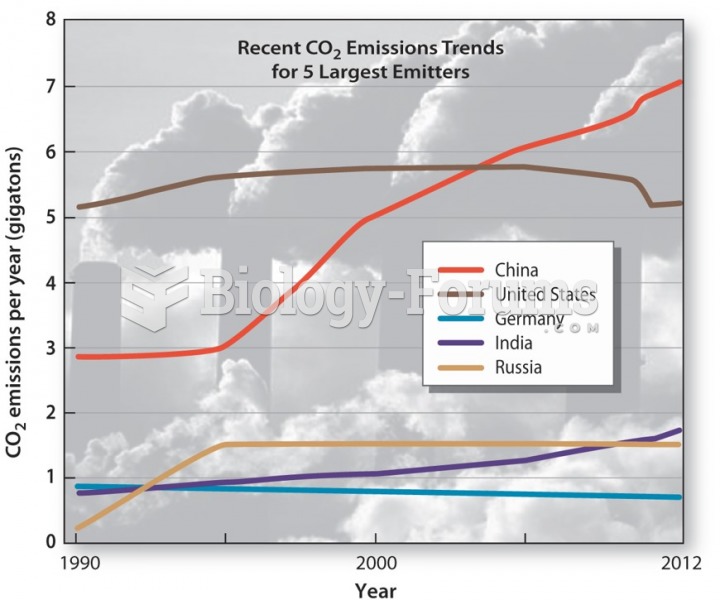 Global Warming: Trends and Tensions