This topic contains a solution. Click here to go to the answer
|
|
|

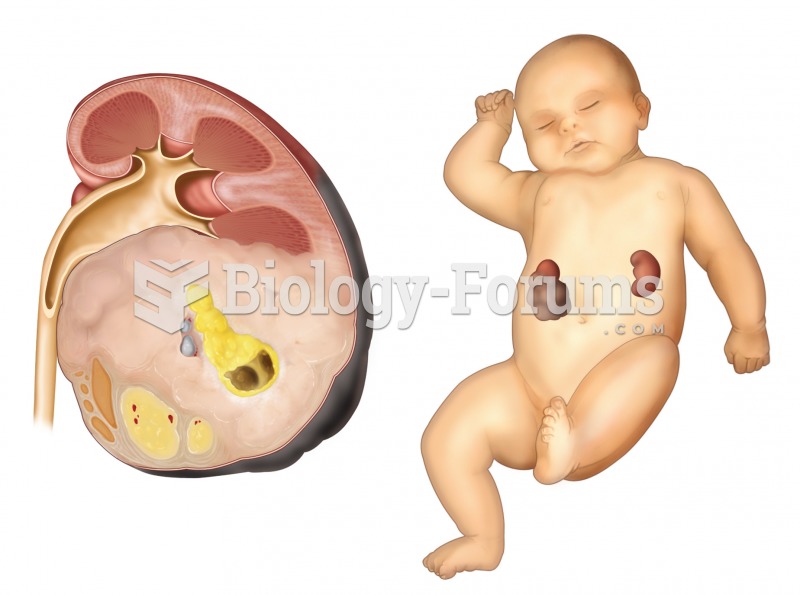 Nephroblastoma. A sectioned kidney reveals the presence of a very large tumor, which arose from feta
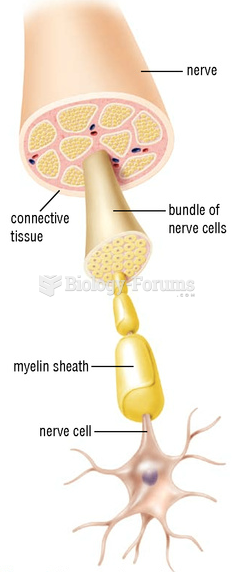 Nerves can transmit many signals at the same time
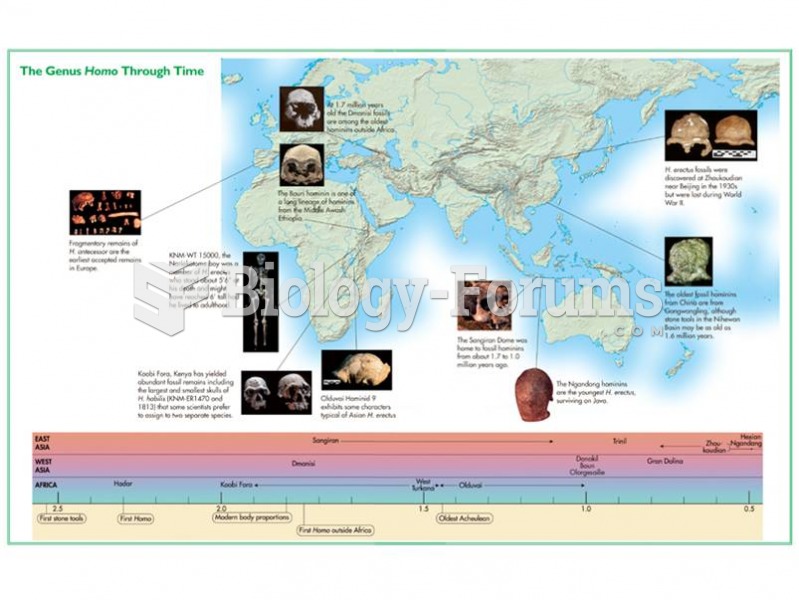 The Genus Homo Through Time
 In 2008, the U.S. economy suffered a gaping wound as several trillion dollars were ripped out of it.
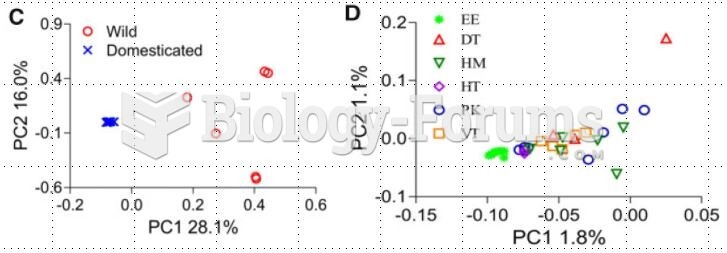 graph
graph
 The time at which the mailman delivers the mail to Ace Bike Shop follows a normal distribution ...