This topic contains a solution. Click here to go to the answer
|
|
|

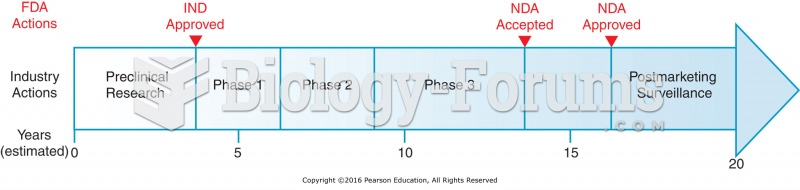 Drug development time line.
 Always take the time to install spark plug wires back into the original holding brackets (wiring ...
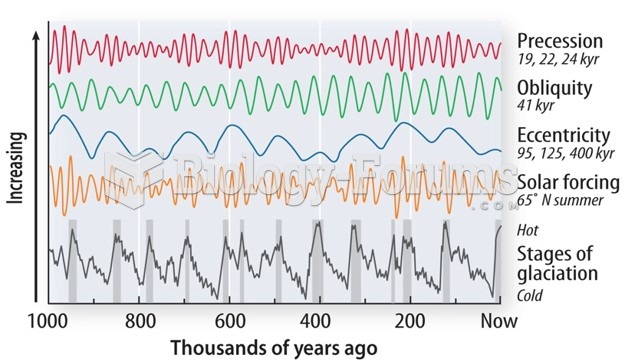 Milankovitch cycles interact over time
 Time Line for Evolution of the Universe
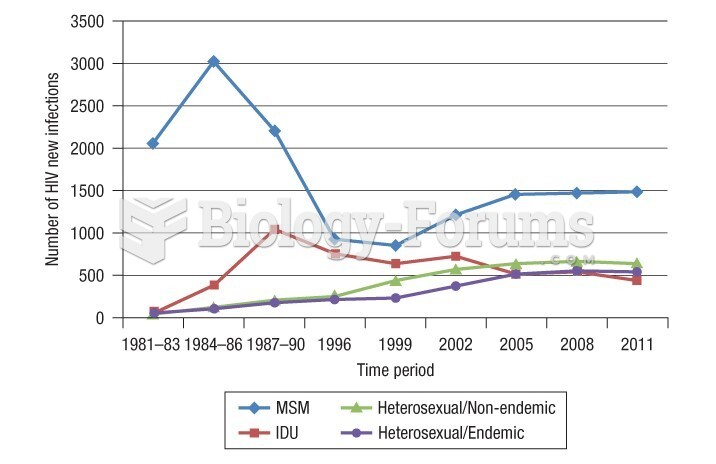 Estimated number of new HIV infections per year over time period in Canada
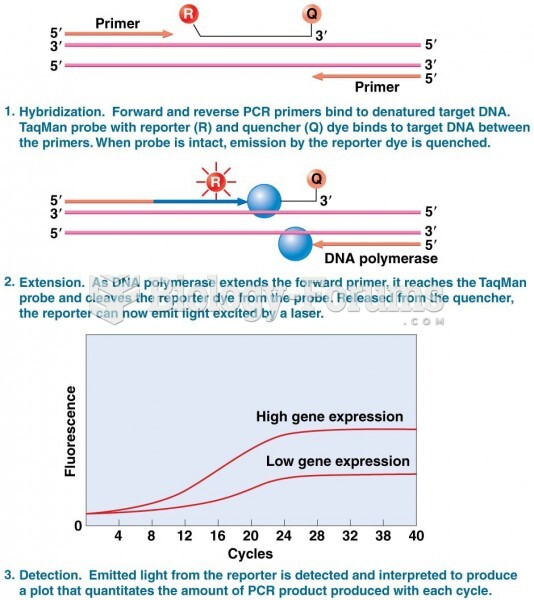 The TaqMan approach to quantitative real-time PCR (qPCR)