This topic contains a solution. Click here to go to the answer
|
|
|

 Remedies for insomnia include increased physical exercise and time spent outdoors.
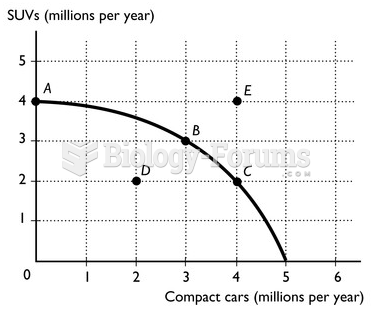 graph
graph
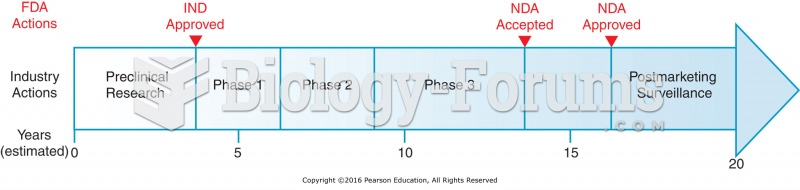 Drug development time line.
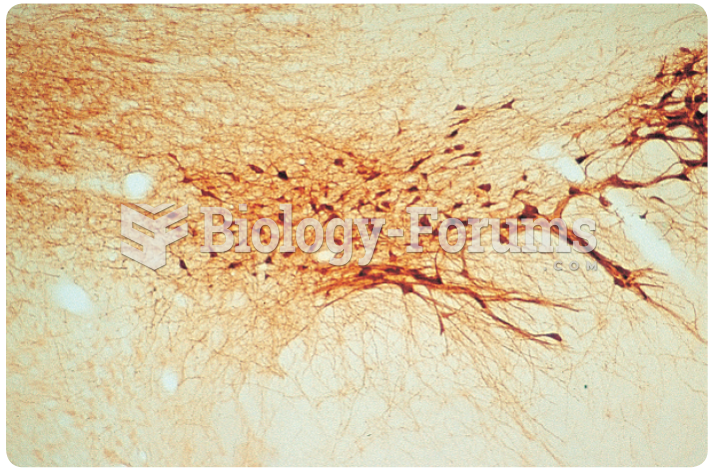 Immunocytochemistry. This section through a rat’s substantia nigra reveals dopaminergic neurons ...
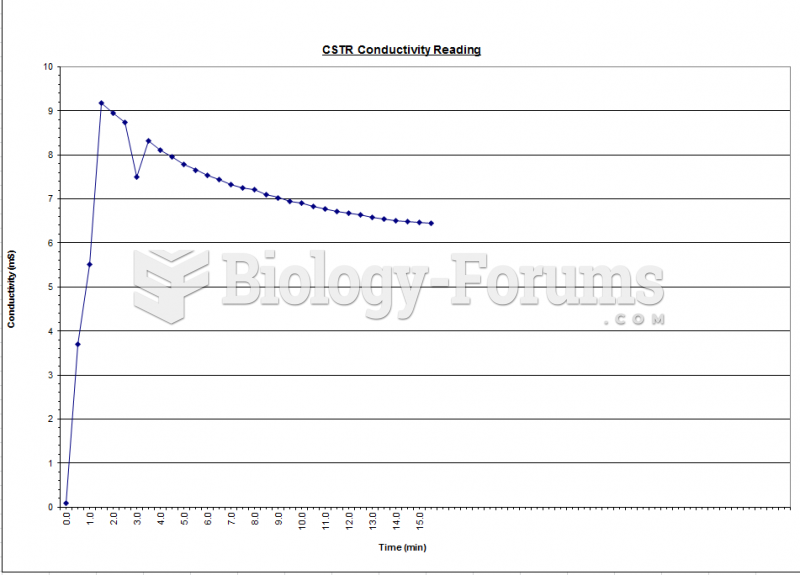 Fluidization - Conductivity Graph
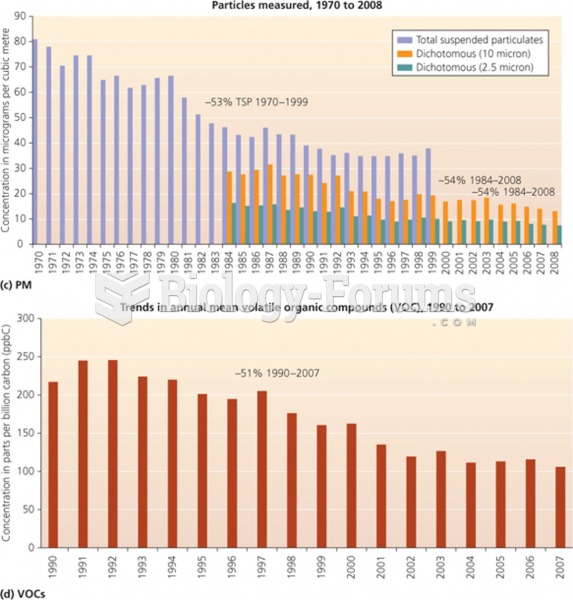 Particles measured, 1970 - 2008 and Trend in Organic Compound 1990 - 2007