|
|
|

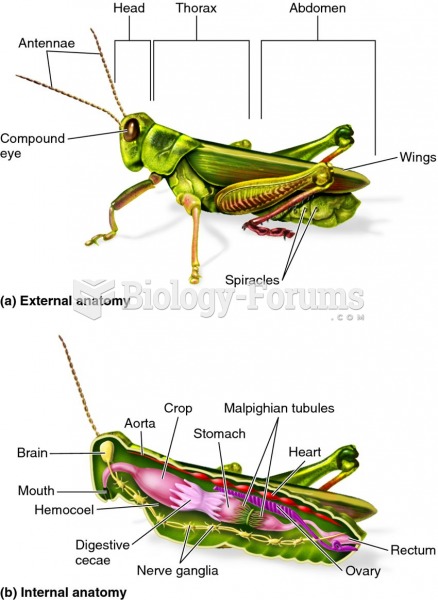 Body plan of an arthropod, as represented by a grasshopper
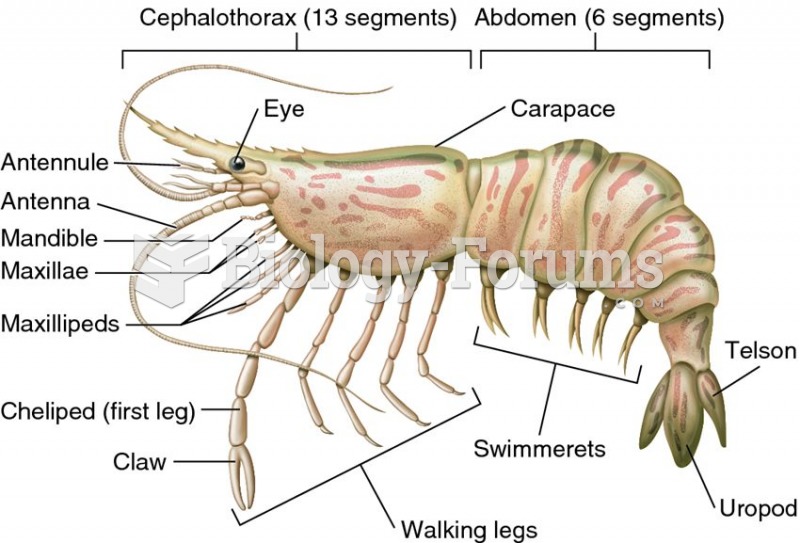 Body plan of a crustacean, as represented by a shrimp
 This girl’s photo illustrates the main features of fetal alcohol syndrome, including a flat nasal ...
 Cereal production in Africa may decrease by as much as 50% by 2080 in some areas
 Managing Supply Chain and Operations: An Integrative Approach, 2nd Edition
 The figure shows an LR circuit with a switch and a 240-volt battery. At the instant the switch ...