|
|
|

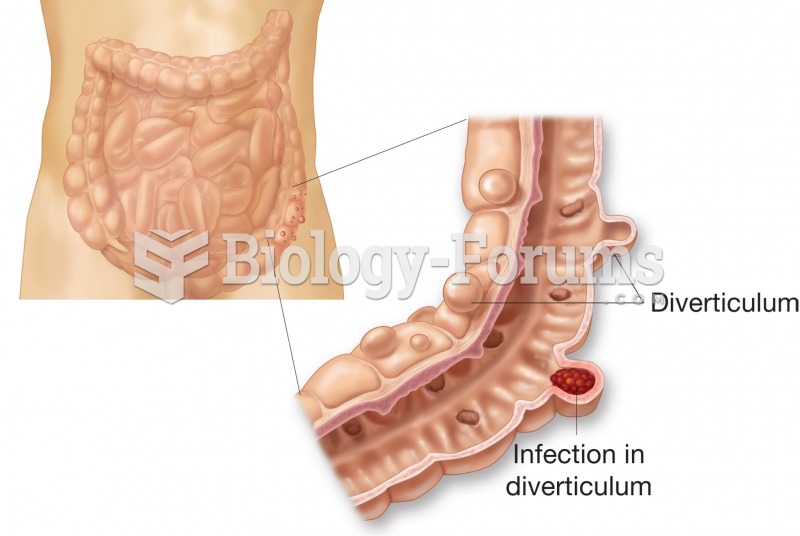 Diverticulosis. Figure illustrates external and internal appearance of diverticula.
 Demonstrate the Application of Triangular, Figure-Eight, and Tubular Bandages
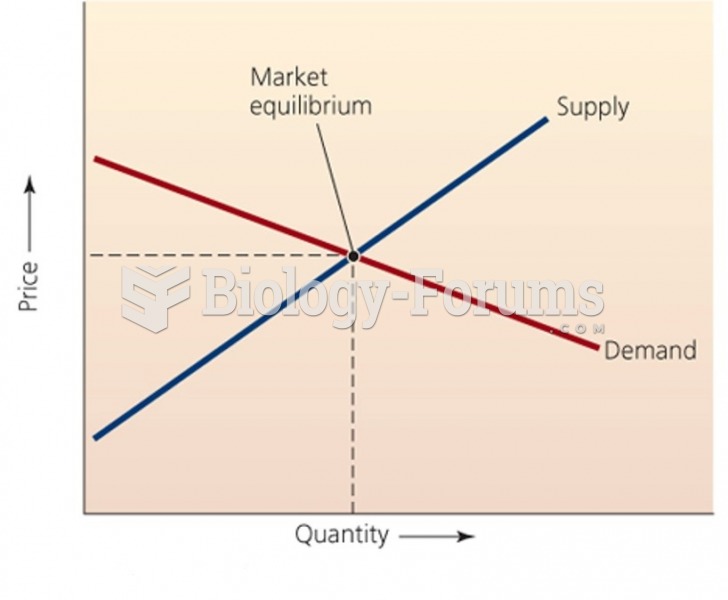 Classic Supply - Demand Curve
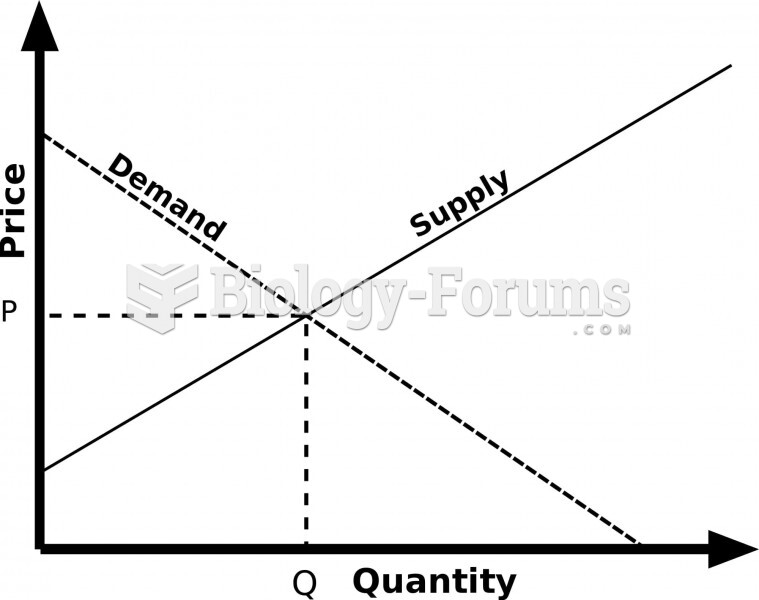 The original Supply and Demand graph
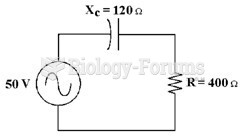 If the frequency equals 60 Hz in Figure 10-1, what is the value of capacitance?
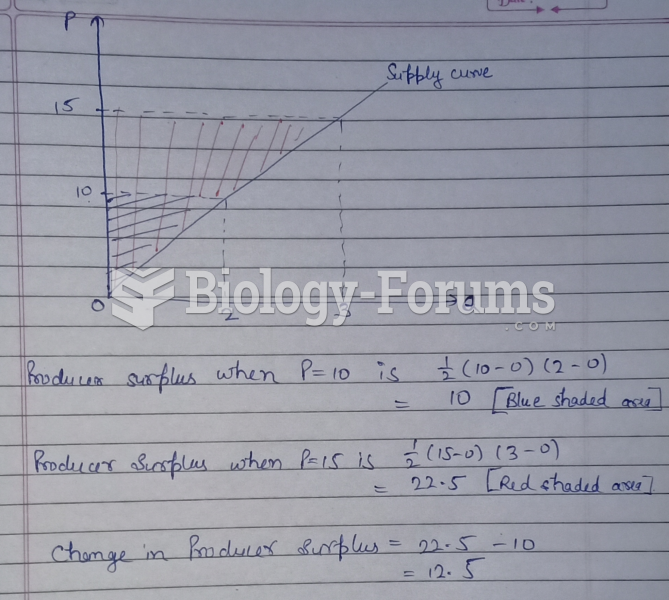 Suppose the market supply curve is p = 5Q. If price increases from 10 to 15, the change in ...