|
|
|

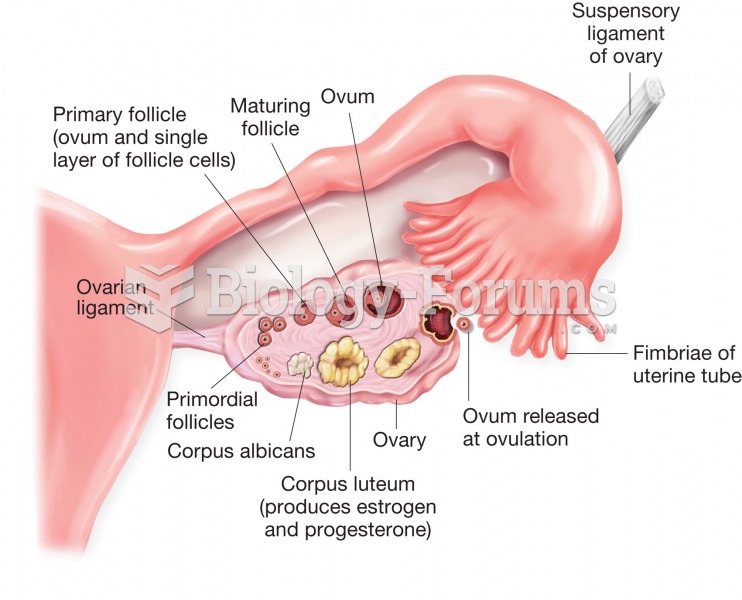 Structure of the ovary and uterine (fallopian) tube. Figure illustrates stages of ovum development a
 How to create a price index to calculate inflation for a basket of goods
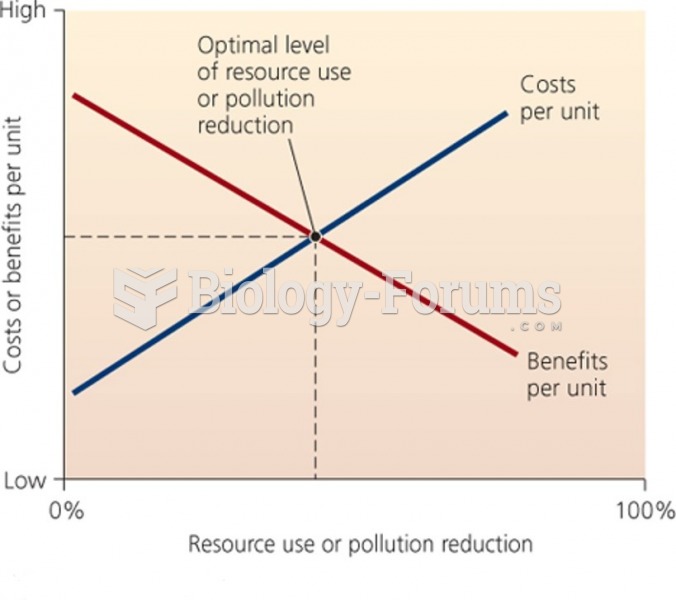 Marginal Supply - Demand Curve
 Keeping your feelings to yourself may increase your stress level
 Swimming Pool (Figure 3.1)
 Lobster and shrimp tacos