|
|
|

 Historian James Merrell notes several errors in Benjamin West’s famous 1771 painting, William Penn’s
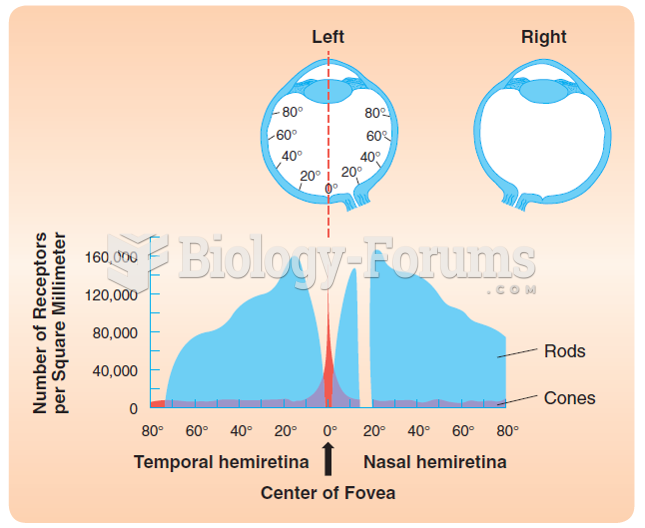 The distribution of cones and rods over the human retina. The figure illustrates the number of cones ...
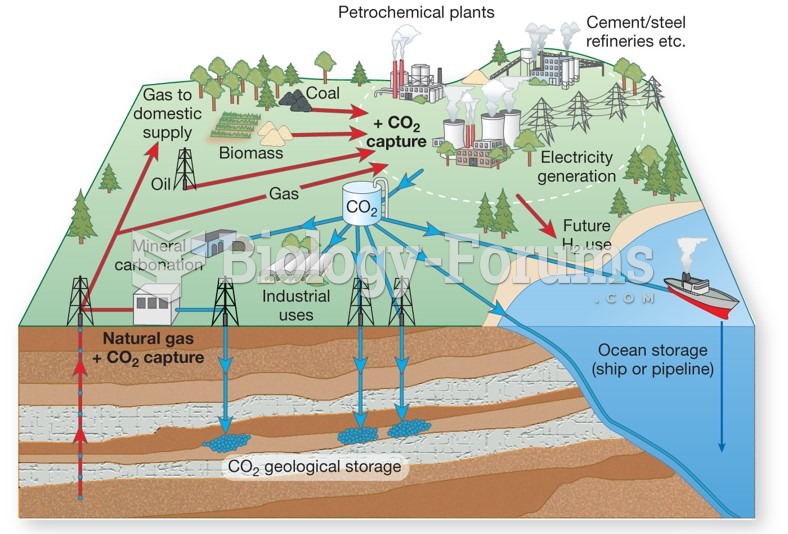 The growing demand for electrical power, carbon sequestration and storage must be a priority
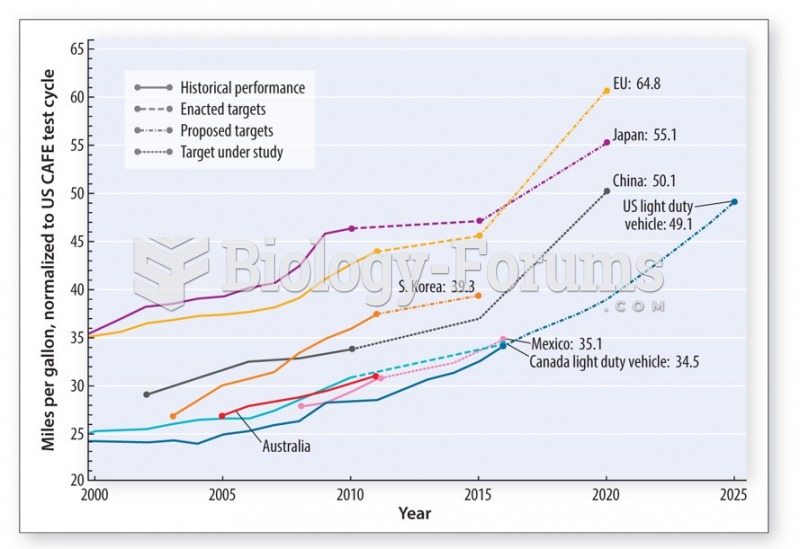 The demand for oil can be reduced significantly with the introduction of new higher vehicle mileage
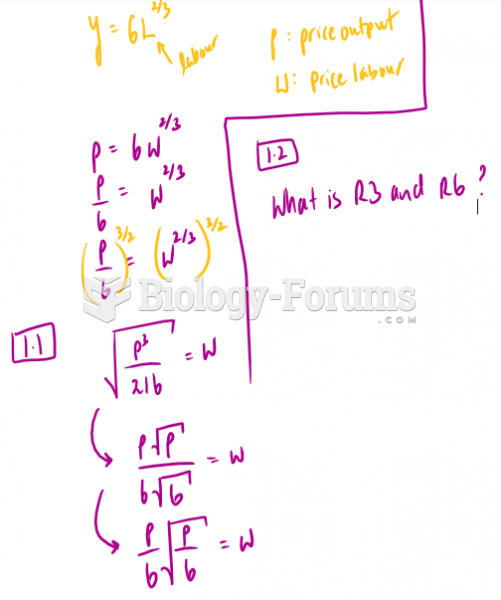 Find the factor demand for labour and the amount of output it will produce. Show all ...
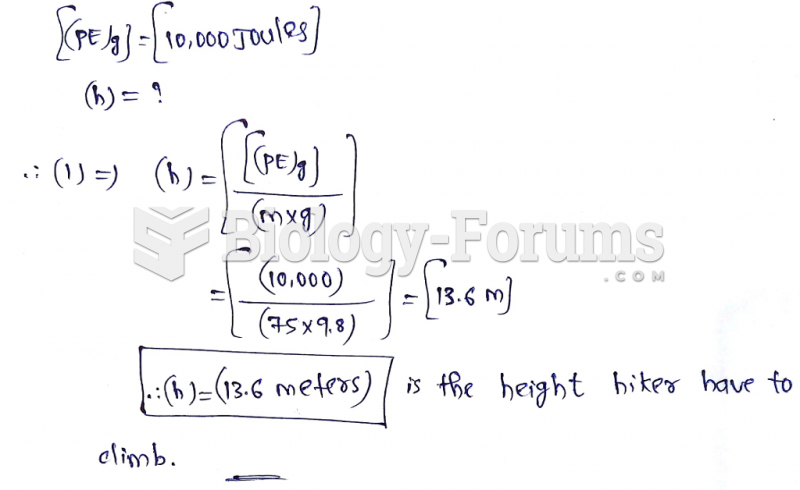 How high a hill would a 75-kg hiker have to climb to increase her gravitational potential ...