This topic contains a solution. Click here to go to the answer
|
|
|

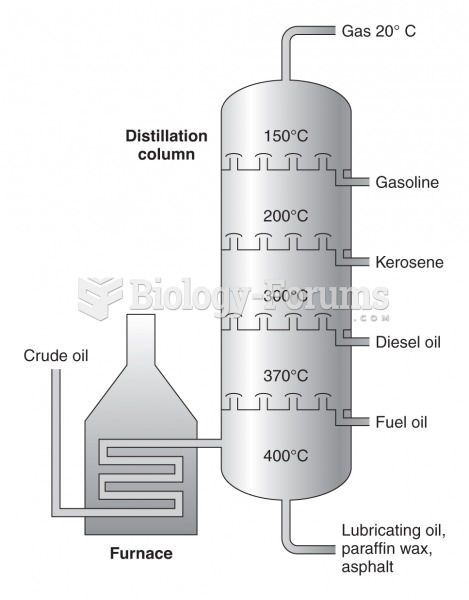 Simplified diagram of the fractional distillation process
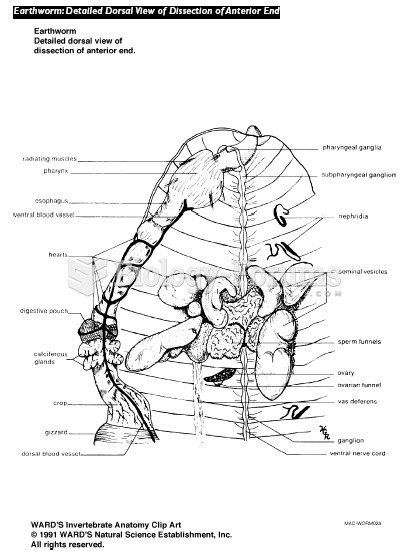 Earthworm Internal Diagram
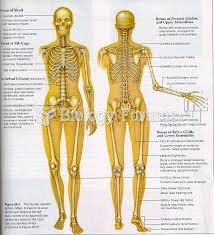 Human Skeleton Diagram
 Phrases that Decrease Customer Service Level
 Demonstrate the Application of Triangular, Figure-Eight, and Tubular Bandages
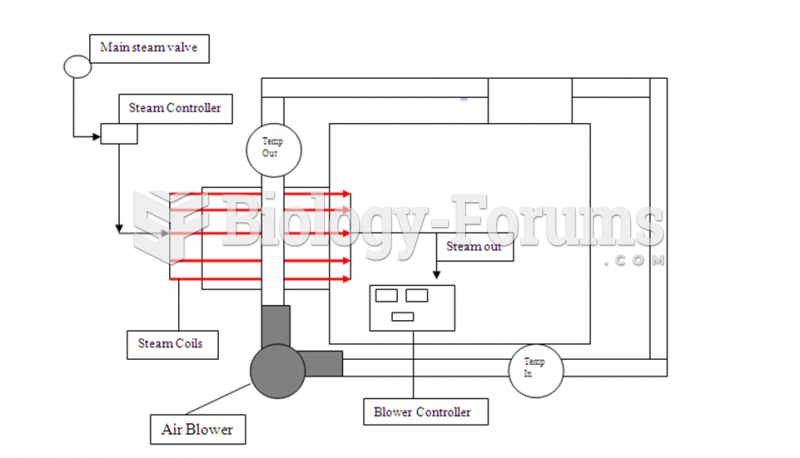 Diagram of Cross Flow Air Dryer