This topic contains a solution. Click here to go to the answer
|
|
|

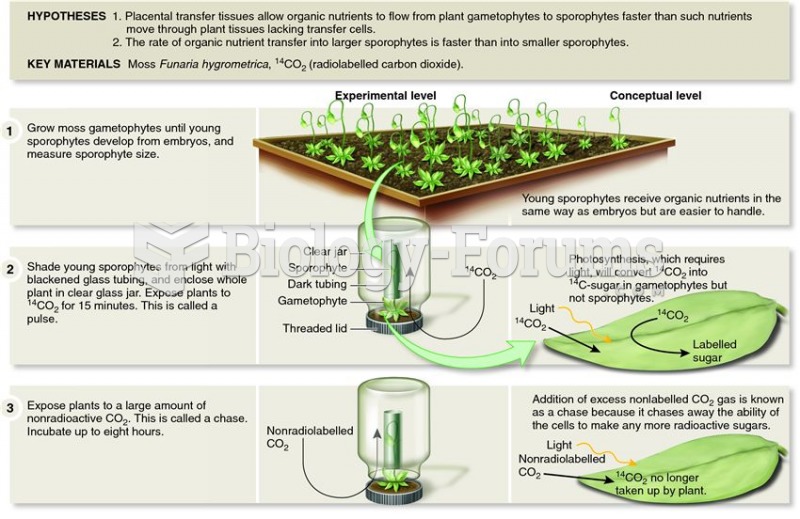 Browning and Gunning demonstrated that placental transfer tissues increase plant reproductive succes
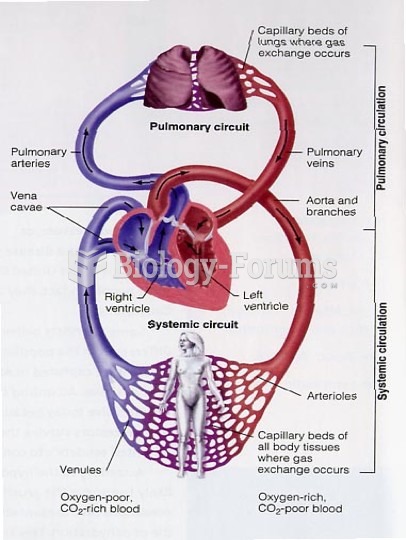 Fetal Circulation Diagram
 Phrases that Decrease Customer Service Level
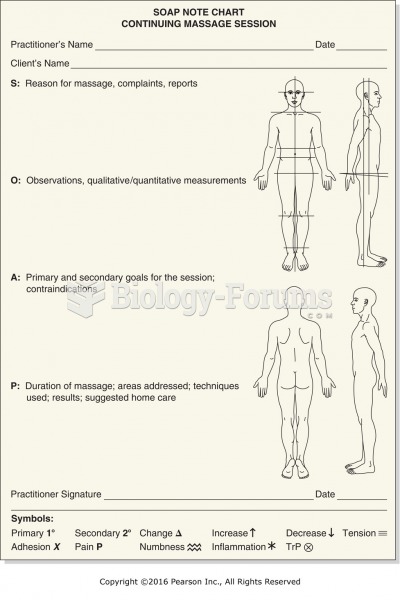 Example of SOAP chart with body diagram.
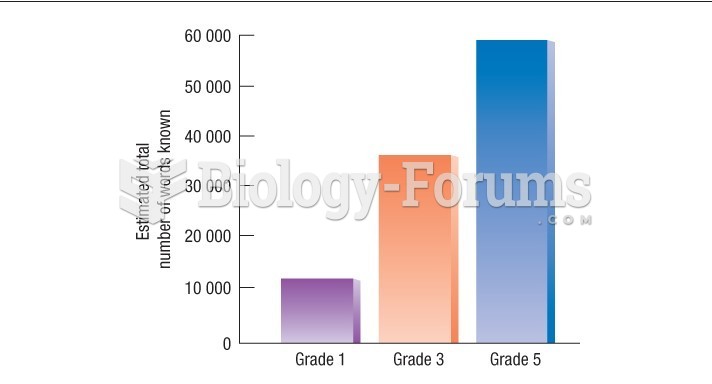 Anglin's estimates of the total vocabulary of children in Grades 1, 3, and 5
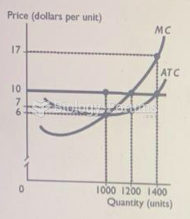 Juan's Software Service Company is in a perfectly competitive market. Juan has total fixed ...