This topic contains a solution. Click here to go to the answer
|
|
|

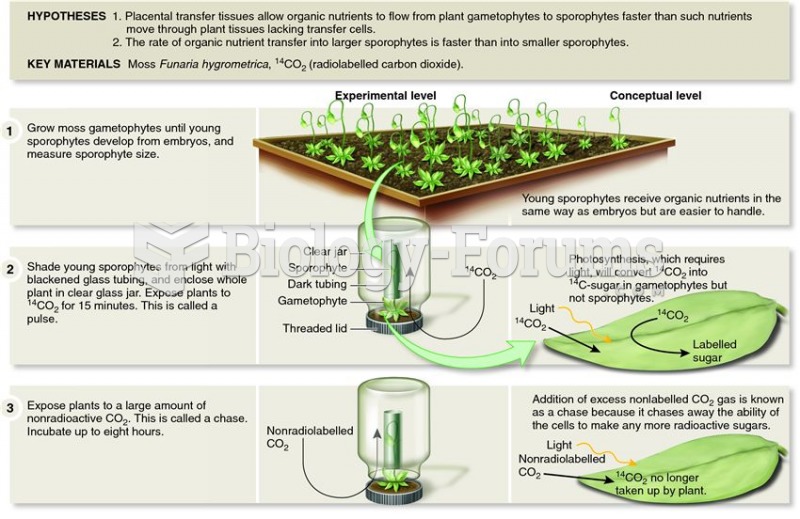 Browning and Gunning demonstrated that placental transfer tissues increase plant reproductive succes
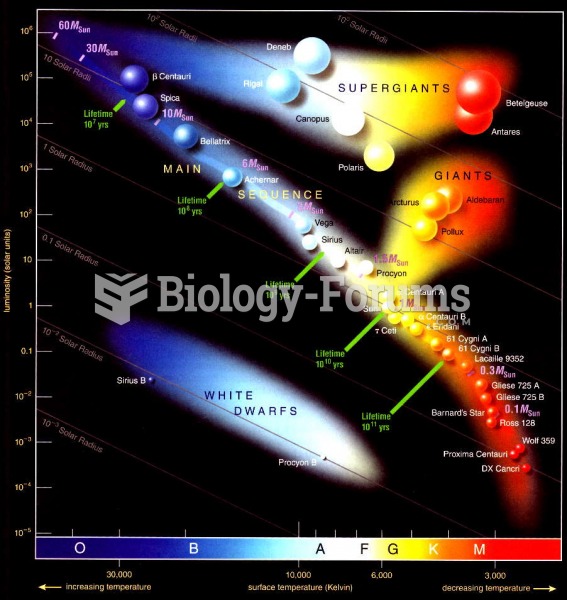 Hertzsprung–Russell diagram
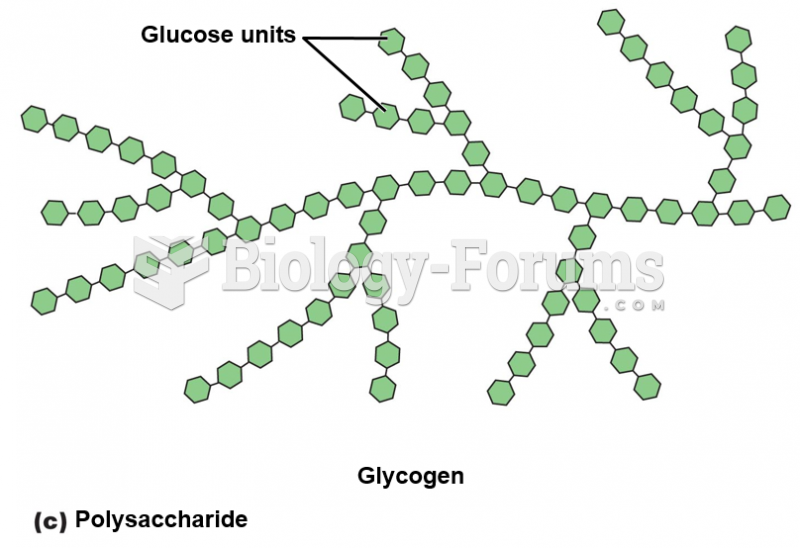 Polysaccharide Diagram
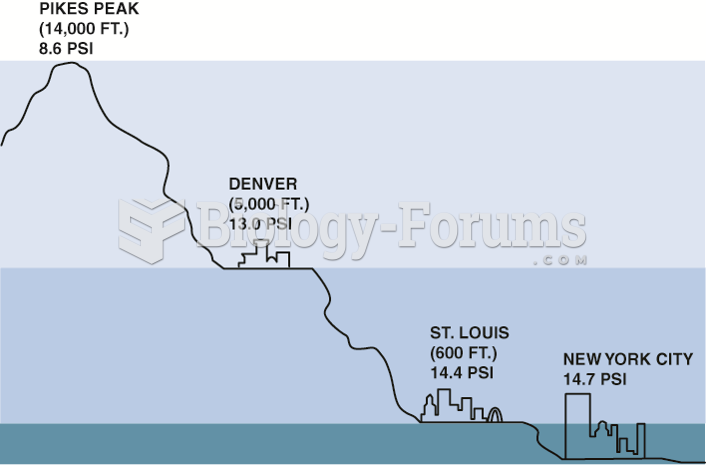 Atmospheric pressure decreases with increase in altitude.
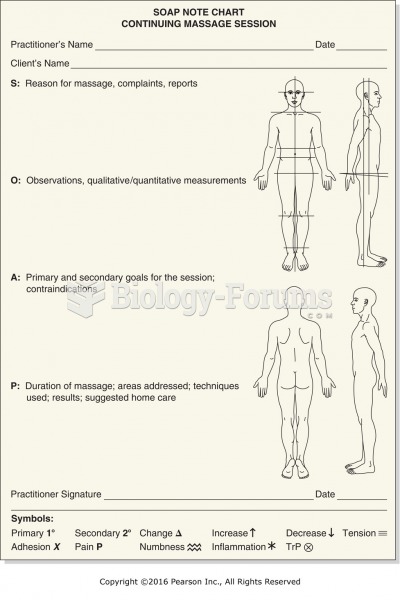 Example of SOAP chart with body diagram.
 Figure of a Woman with a Drawing Showing Evidence of Original Painting and Outlining Design Scheme