This topic contains a solution. Click here to go to the answer
|
|
|

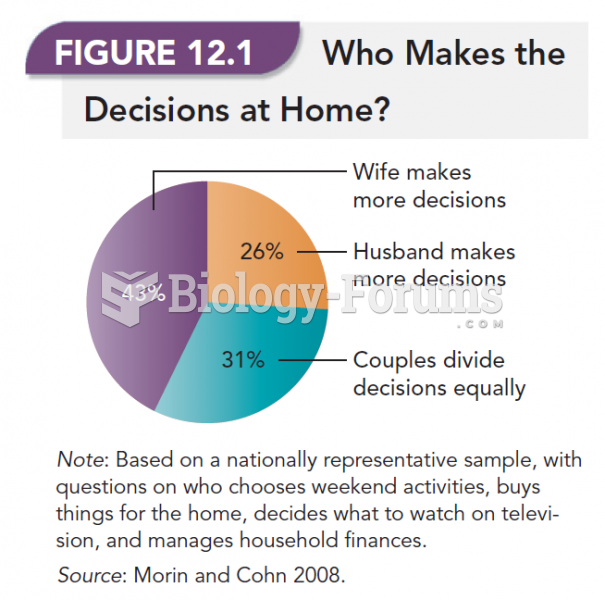 Who Makes The Decisions at Home?
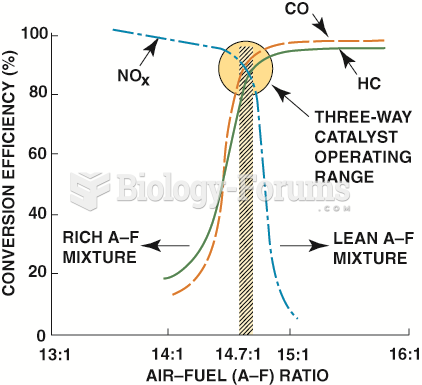 With a three-way catalytic converter, emission control is most efficient with an air–fuel ratio ...
 Detonation is a secondary ignition of the air–fuel mixture. It is also called spark knock or ...
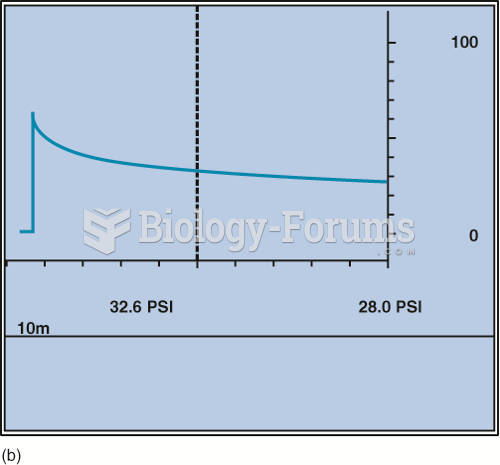 Pressure drop after 10 minutes on a normal port fuel-injection system.
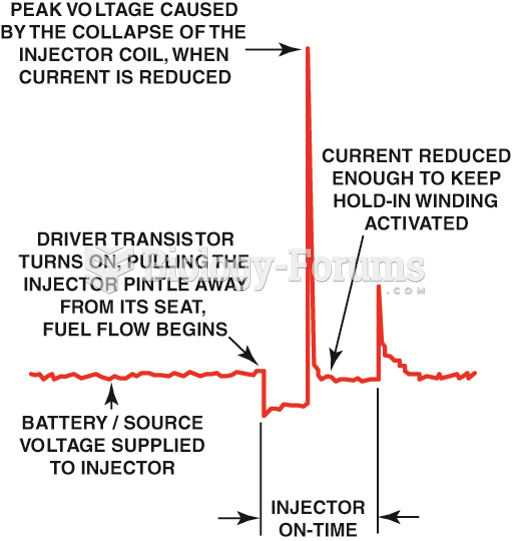 A typical peak-and-hold fuel-injector waveform. Most fuel injectors that measure less than 6 ohms ...
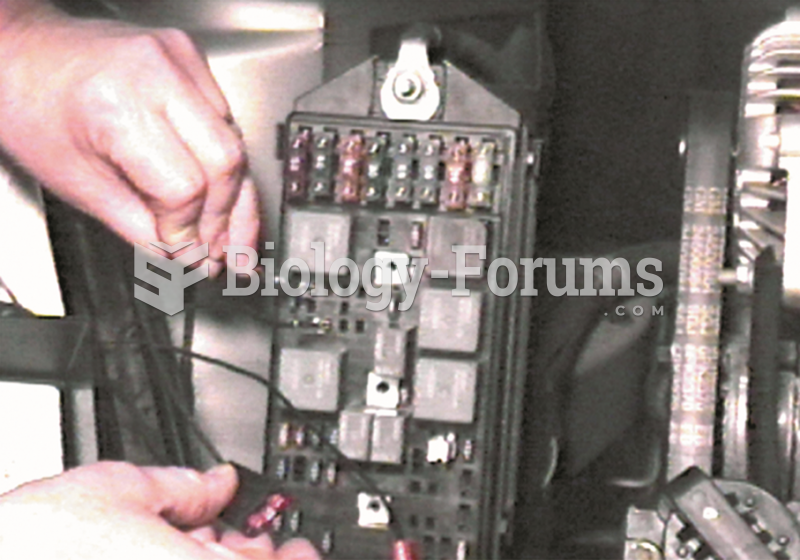 To check to see if the electric fuel pump can be operated from the relay contacts, use a fused ...