This topic contains a solution. Click here to go to the answer
|
|
|

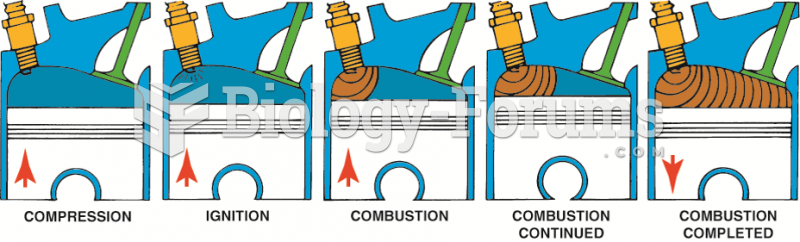 Normal combustion is a smooth, controlled burning of the air–fuel mixture.
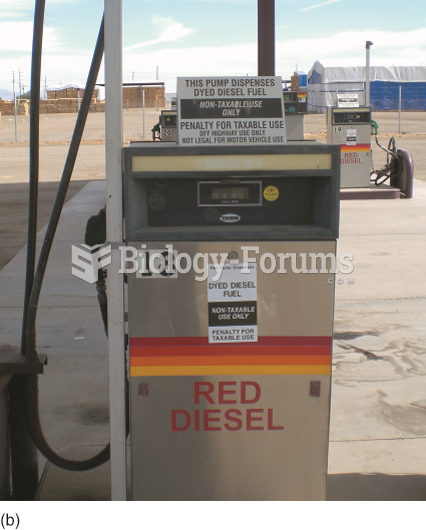 A fuel pump in a farming area that clearly states the red diesel fuel is for off-road use only ...
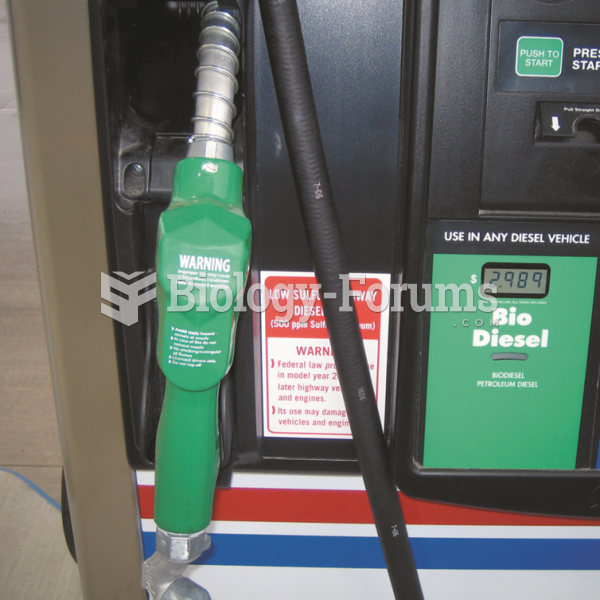 A pump decal indicating that the biodiesel fuel is ultra-low-sulfur diesel (ULSD) and must be used ...
 The vehicle’s fuel pump is disabled by removing its relay or fuse. In some cases, it may be ...
 Warming friction using the knuckles. The first two knuckles move back and forth on the skin to ...
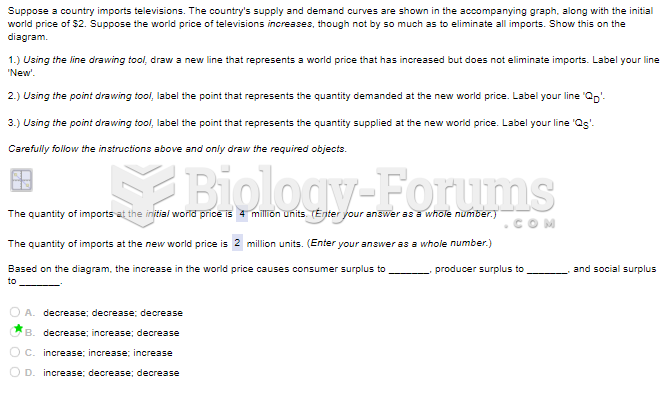 Suppose a country imports televisions. The country's supply and demand curves are shown in ...