This topic contains a solution. Click here to go to the answer
|
|
|

 Sheryl Crow - If It Makes You Happy
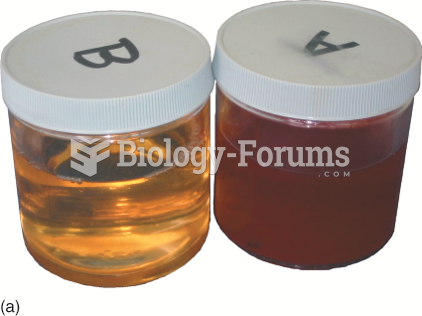 Regular diesel fuel on the left has a clear or greenish tint, whereas fuel for off-road use is ...
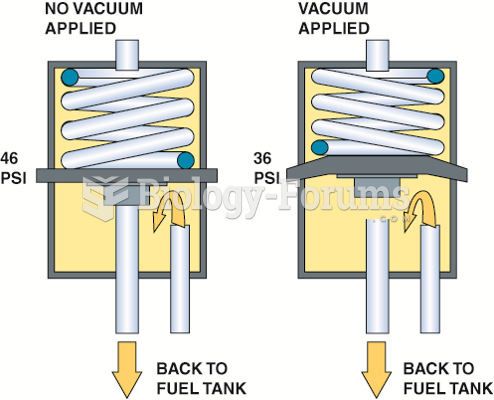 A typical fuel-pressure regulator that has a spring that exerts 46 pounds of force against the ...
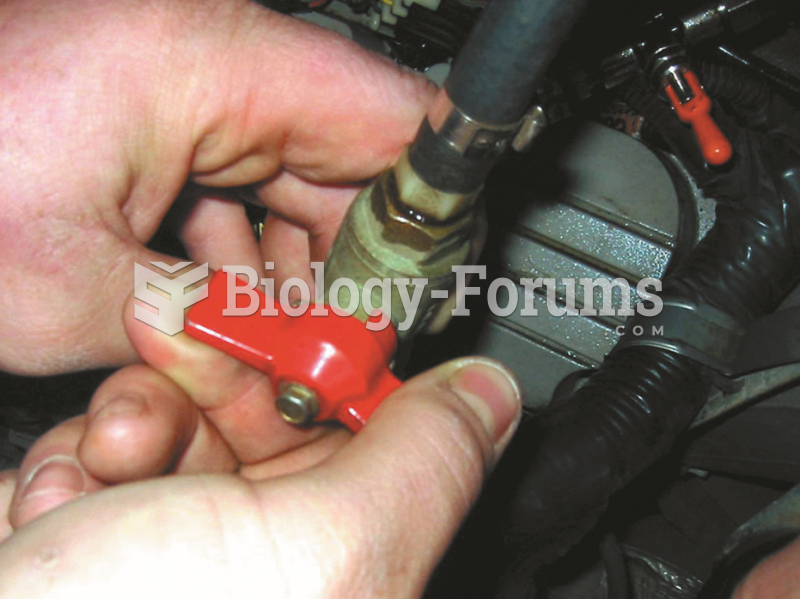 Shutoff valves must be used on vehicles equipped with plastic fuel lines to isolate the cause of a ...
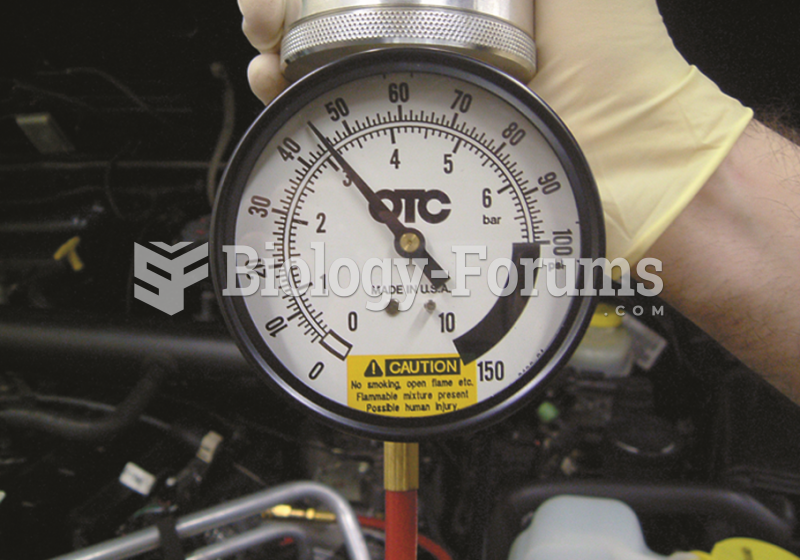 Canister pressure should be adjusted to 5 PSI below system fuel pressure. An alternative for ...
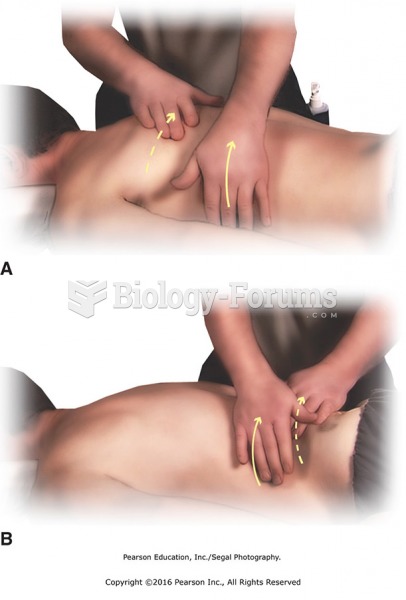 Pull-ups from shoulder to buttocks. (A) Move across the shoulder, fingertips between the ribs. (B) ...