This topic contains a solution. Click here to go to the answer
|
|
|

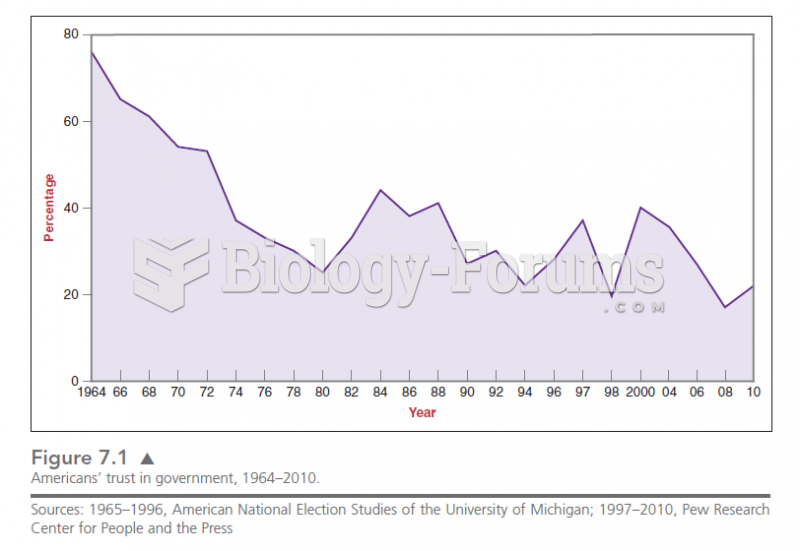 Figure 7.1 shows the rapid decline in the trust of Americans in government since the 1960s. This de
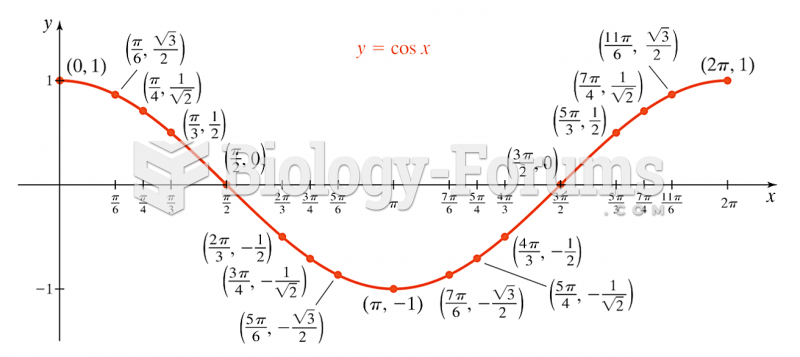 Graph of cos(x)
 Sketch a graph of the function h(x), by hand on the following interval:
 If a graph has the following x-intercepts, which value of x is the instantaneous rate of change ...
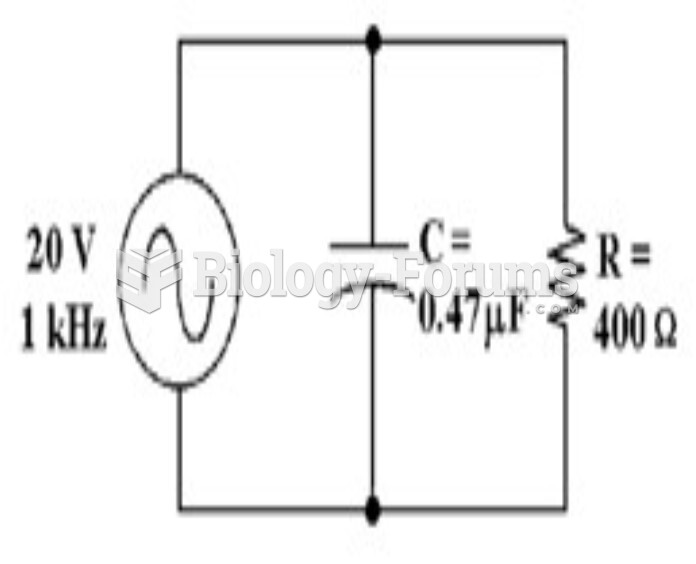 How much voltage does the resistor drop in Figure 10-2?
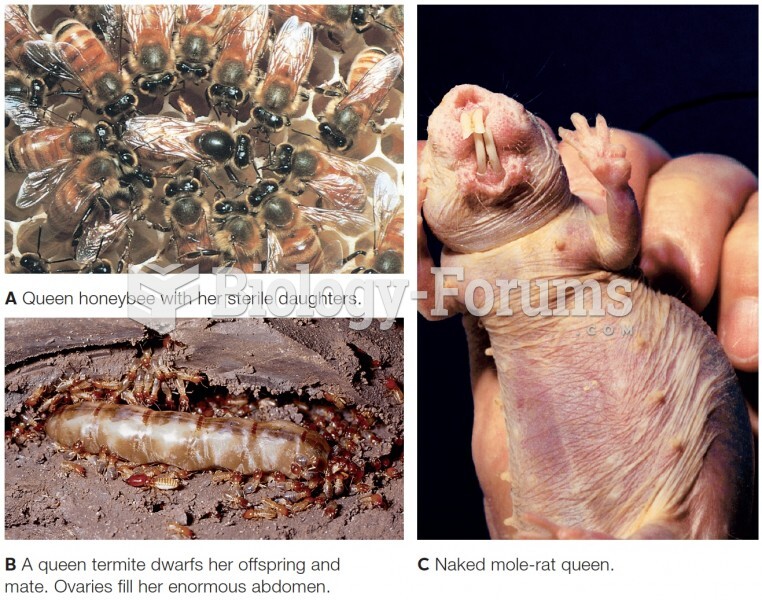 Three queens, fertile females in species that have a reproductive division of labor.