This topic contains a solution. Click here to go to the answer
|
|
|

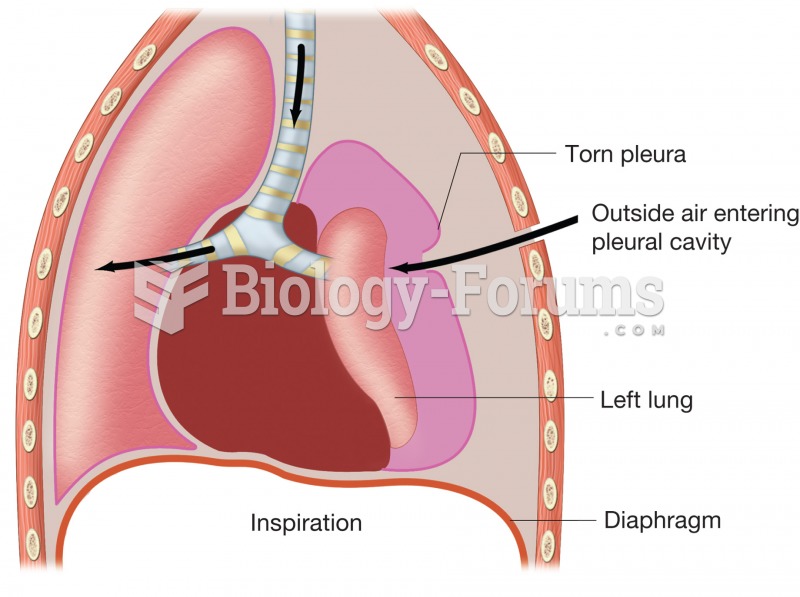 Pneumothorax. Figure illustrates how puncture of thoracic wall and tearing of pleural membrane allow
 Richard Rodriguez represents millions of immigrants—not just those of Latino origin but those from ...
 Mobilize joints of the feet and ankle. Apply scissoring to metatarsals and figure-8s to toes. Dorsi- ...
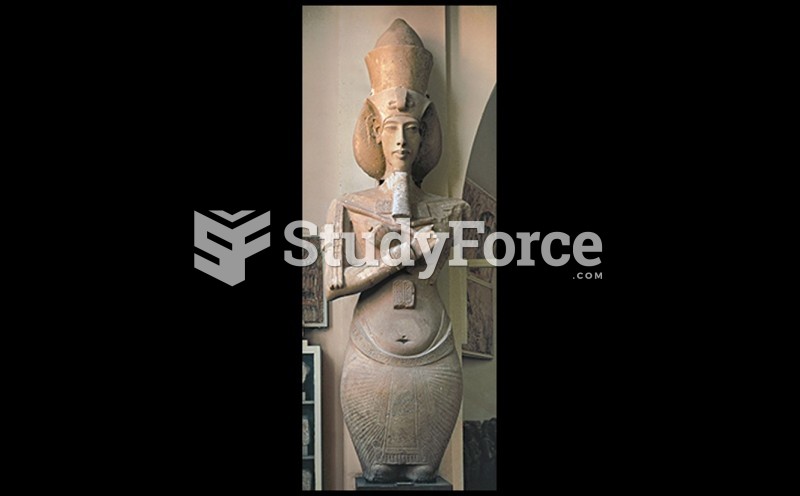 Colossal Figure of Akhenaten
 a solution is prepared in which a trace or small amount of Fe2+ is added to a much larger ...
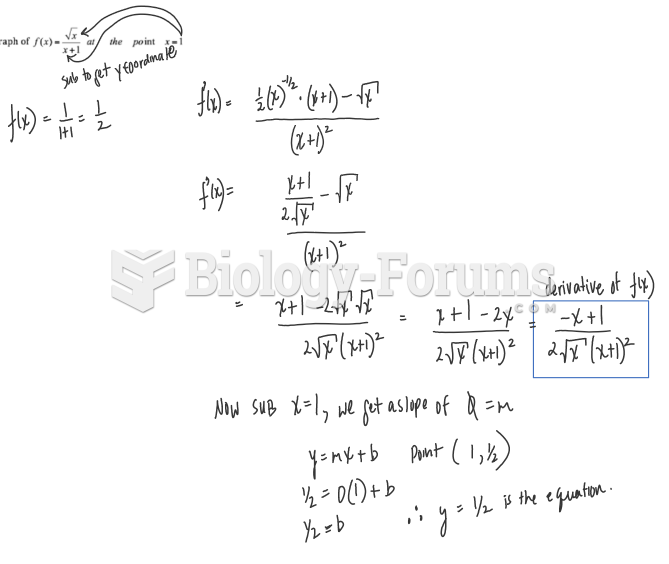 Find an equation of the tangent line to the graph of f(x) = sqrt(x) / (x+1) at the point x=1