This topic contains a solution. Click here to go to the answer
|
|
|

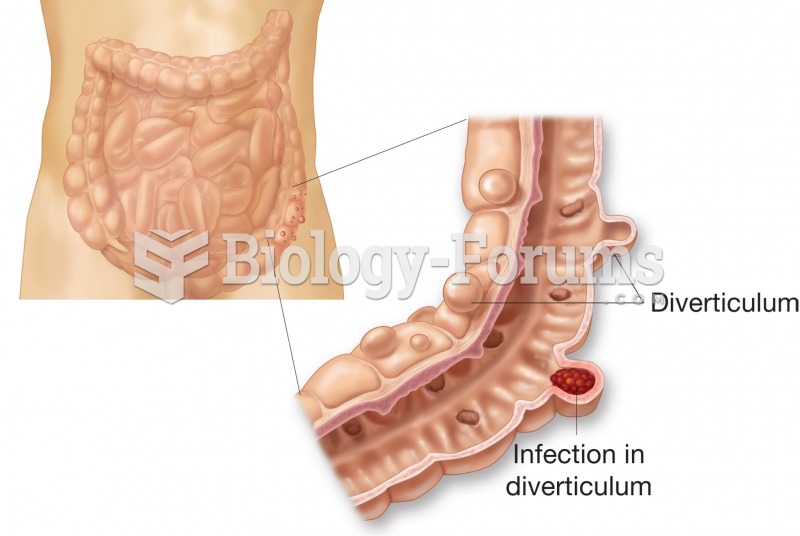 Diverticulosis. Figure illustrates external and internal appearance of diverticula.
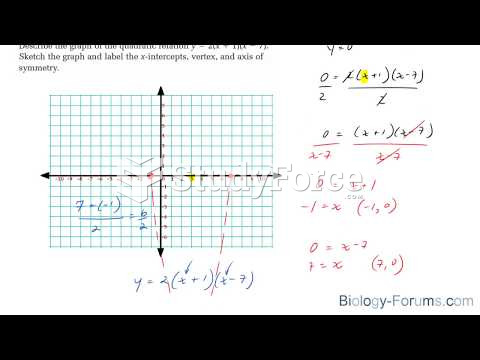 How to graph quadratic equations that are in factored form y=a(x−r)(x−s)
 The Stages of Labor and Birth in a Vaginal Delivery
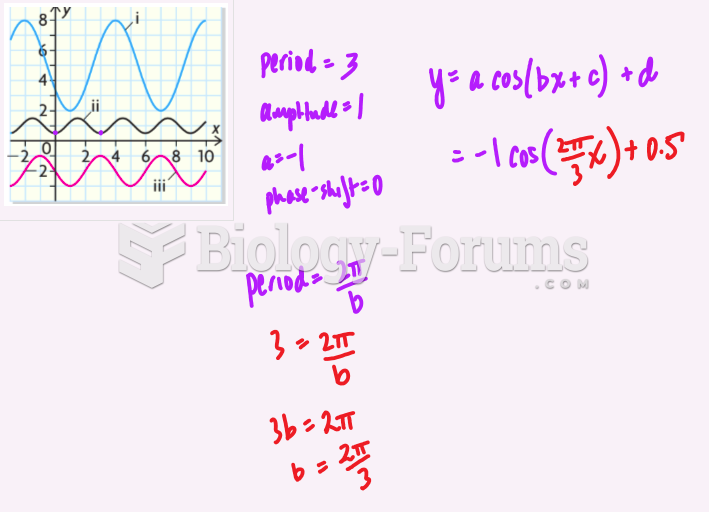 Graph to Function Cosine
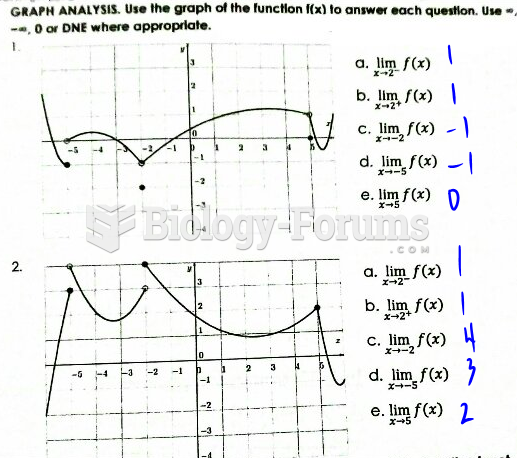 Use the graph of the function f(x) to answer each question.
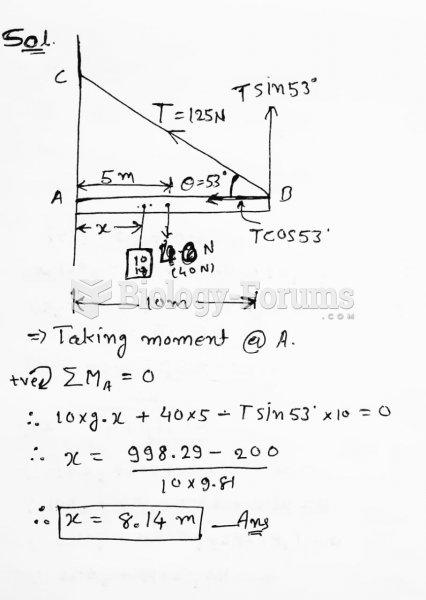 In the figure, a 10.0-m long bar is attached by a frictionless hinge to a wall and held ...