This topic contains a solution. Click here to go to the answer
|
|
|

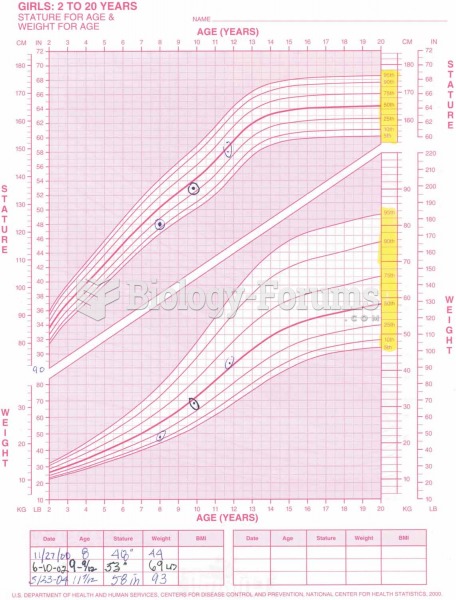 Pediatric growth chart.
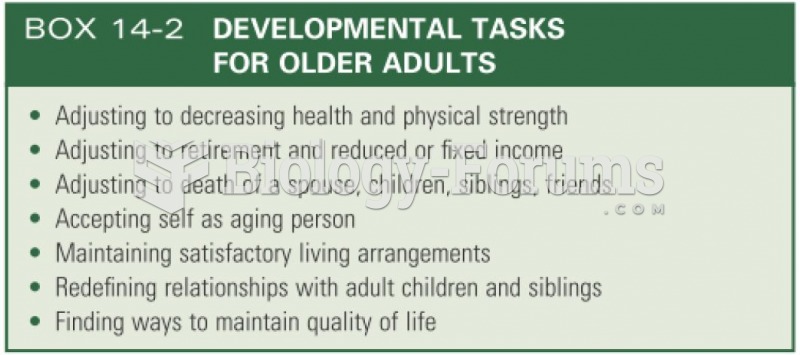 Developmental tasks for older adults
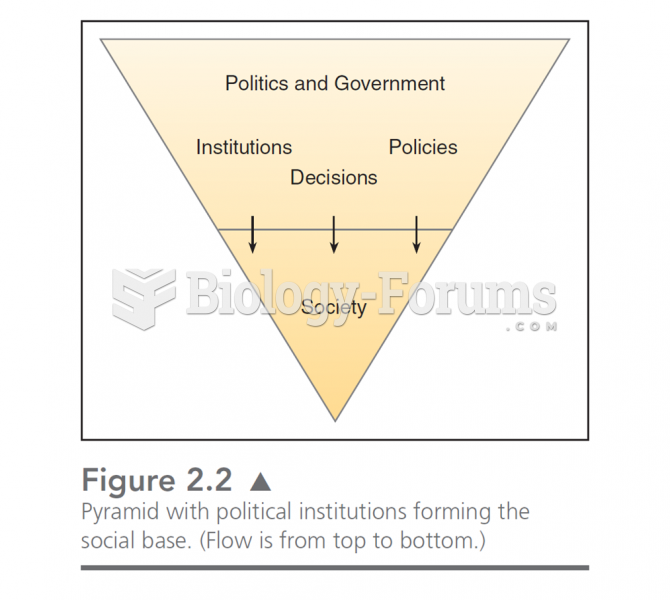 This chart illustrates the “drip down” model of government. In this, politics is formed by the soc
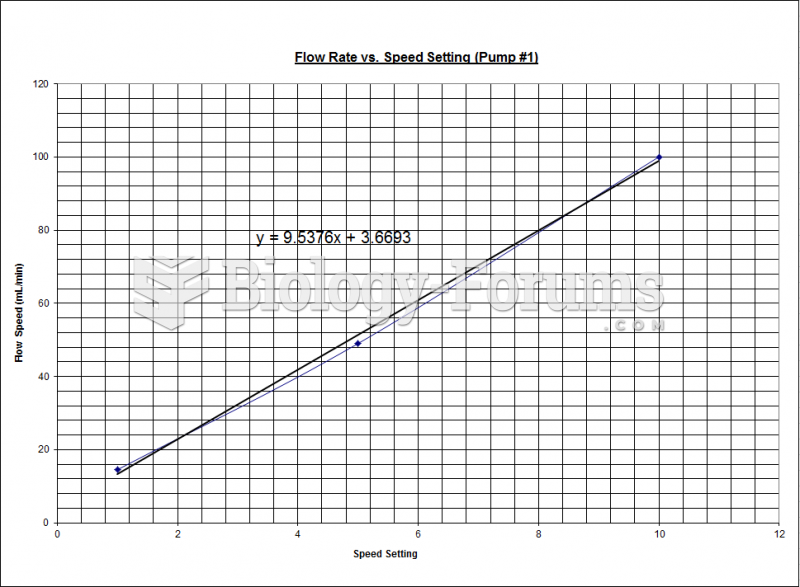 Fluidization - Chart Pump #1
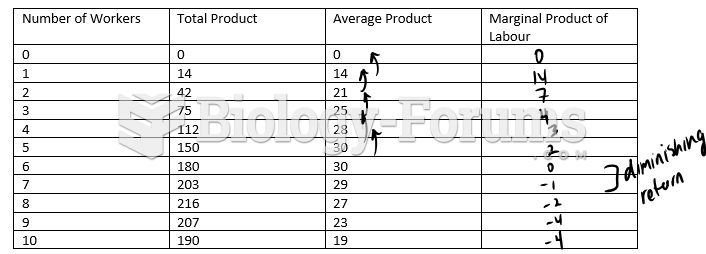 Complete the following production chart and plot the points.
 A truncated cell lineage chart for C. elegans