This topic contains a solution. Click here to go to the answer
|
|
|

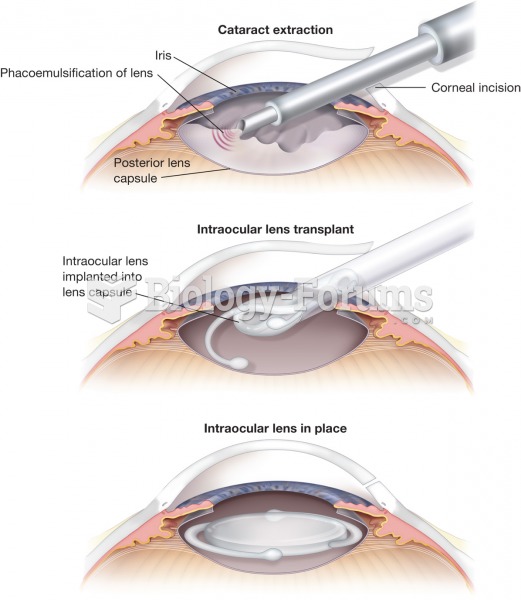 Cataract extraction. The procedure involves a surgical removal of a cataract lens and its replacemen
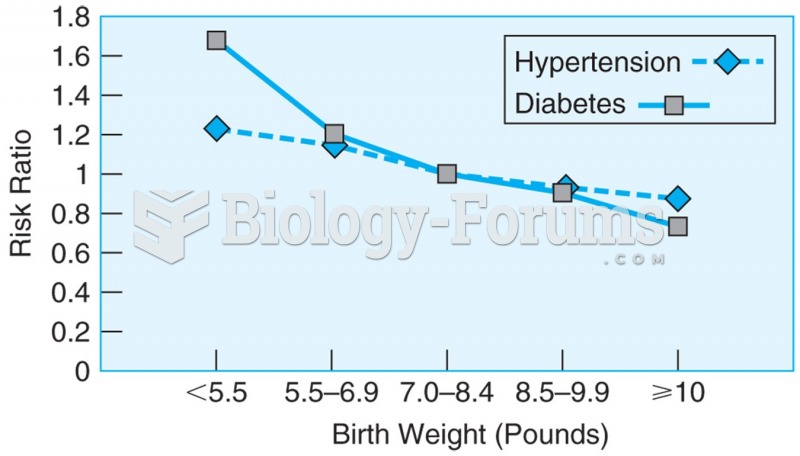 Data from more than 22,000 men over the age of 40, showing the relationship between birth weight and ...
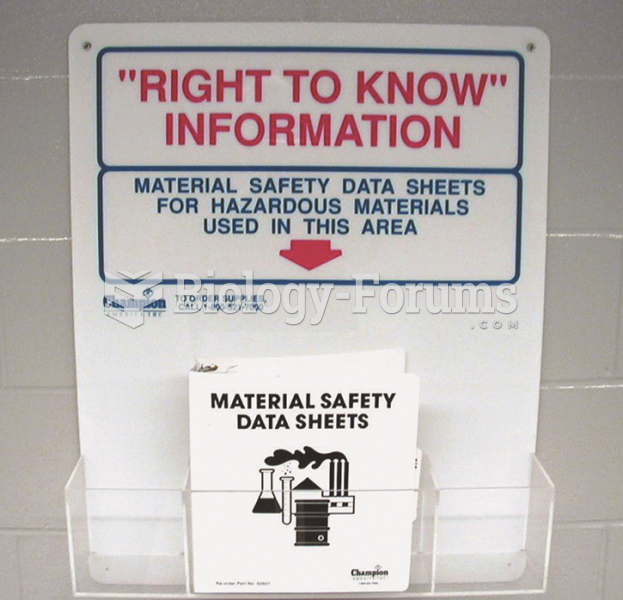 Material safety data sheets (MSDS), now called safety data sheets (SDS), should be readily available ...
 Create a soapy lather with the hands and spread the soap up to the elbows. Liquid soap is preferred. ...
 Basic Marketing Research: Using Microsoft Excel Data Analysis
 Different forms of a gene are called alleles