This topic contains a solution. Click here to go to the answer
|
|
|

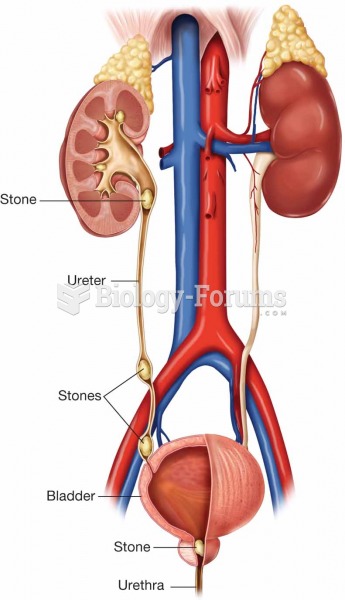 Renal calculi (stones) can form in several areas within the urinary tract. When they form in the kid
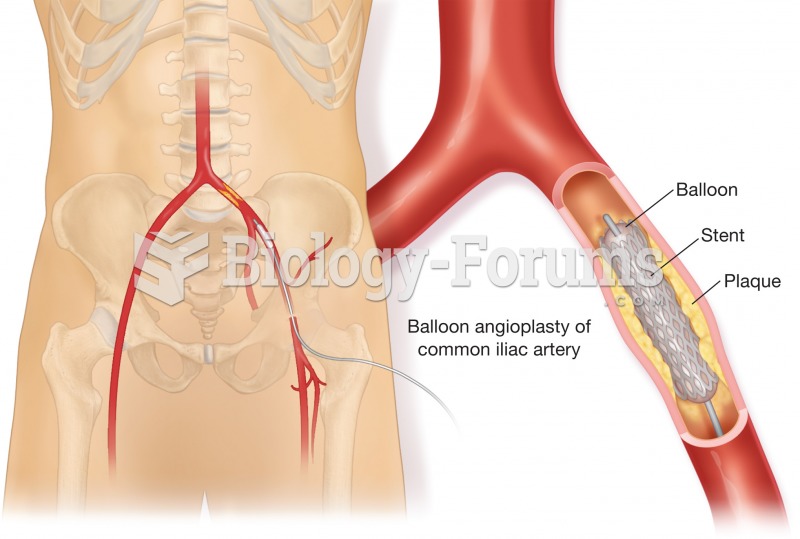 Angioplasty. One form is called balloon angioplasty, shown here. A balloon catheter is threaded into
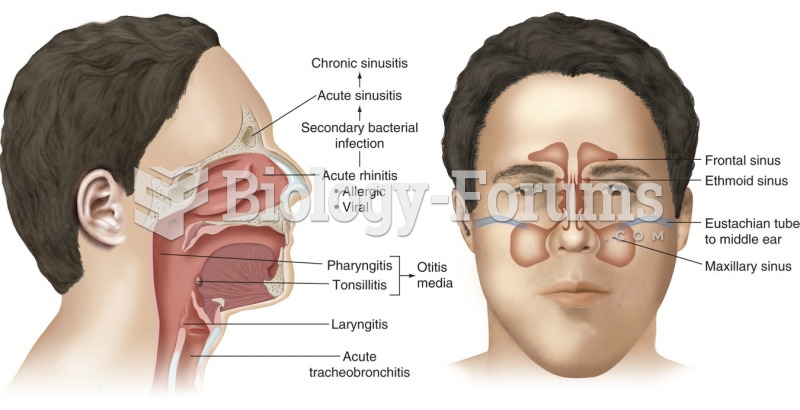 Paranasal sinuses are part of the upper respiratory system. From here, infections may spread via the ...
 Flow cytometry data that shows the differences in CD3+ CD4+ cells that occur with HIV infection. ...
 How to find the quartiles and percentiles for a data set
 data
data