This topic contains a solution. Click here to go to the answer
|
|
|

 The paleoanthropologist must understand these deformations in order to figure out which strata a fos
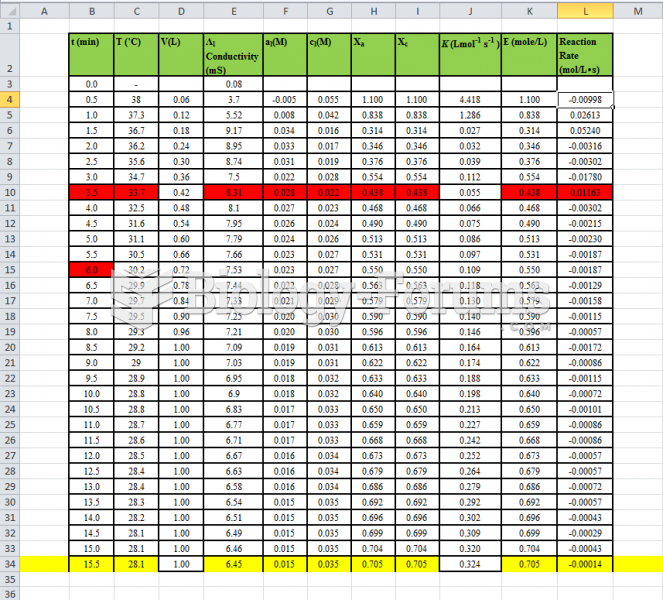 Fluidization - Data Table of experiment
 Stretch the extensor muscles with flexion at the wrist. Reposition the palm to face the table. Apply ...
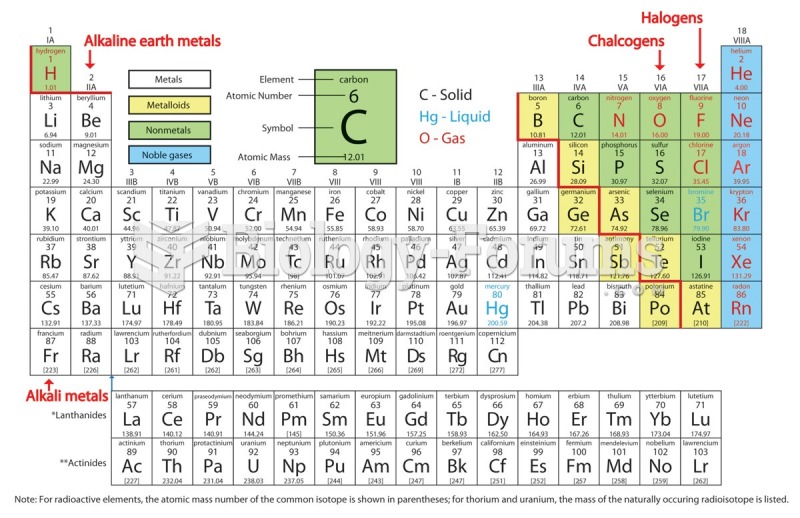 The periodic table of the elements
 Christmas table decoration ideas
 Table - Analysis