This topic contains a solution. Click here to go to the answer
|
|
|

 The phosphorus cycle. Numbers are 1012 g P or fluxes as 1012 g P per year (data from Schlesinger 199
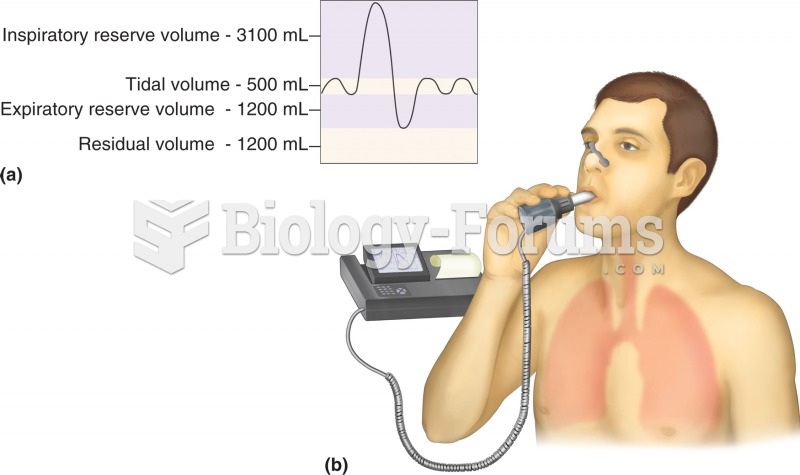 Pulmonary function test: spirometry. (a) Normal respiratory volumes, as measured during spirometry.
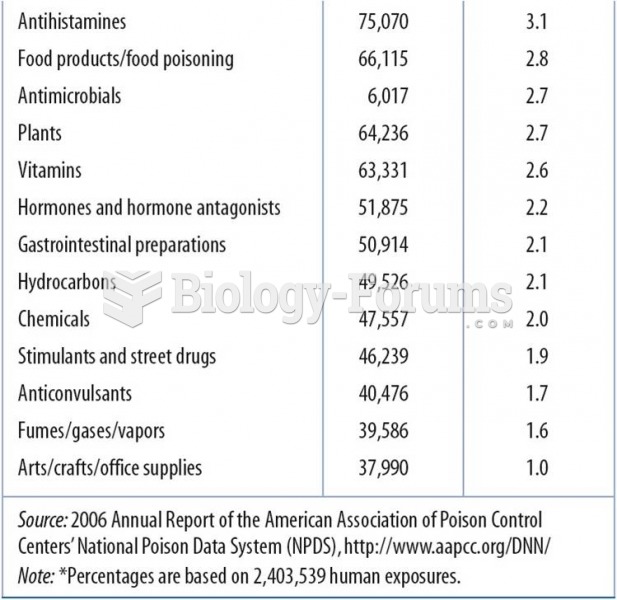 2006 Data:Top 25 Substances Involved in Human Exposures
 Human Figure
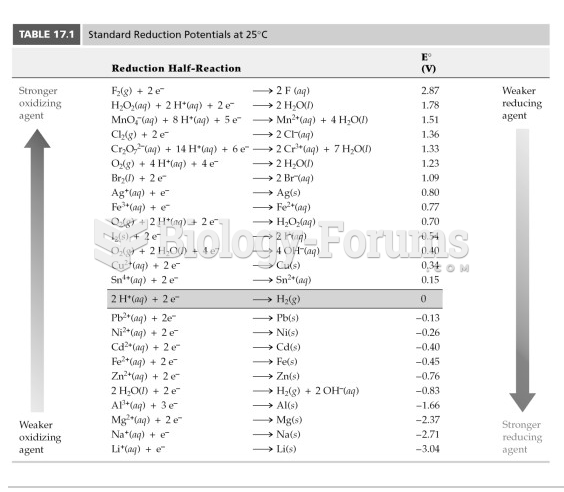 According to Table 17.1, which will reduce water but not Mg2+?
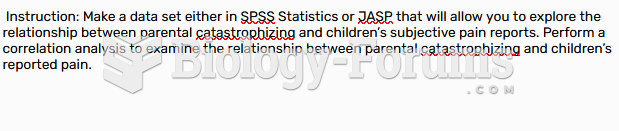 Table - Correlation Analysis