This topic contains a solution. Click here to go to the answer
|
|
|

 Diphtheria. The bacteria that cause this disease, called Corynebacterium diphtheriae, proliferate in
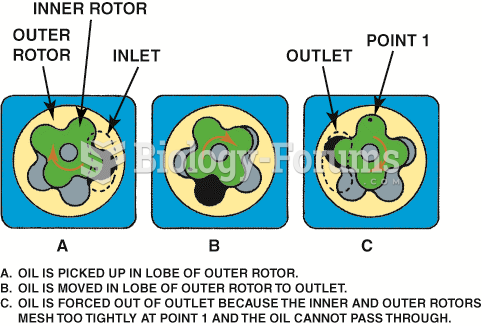 The operation of a rotor-type oil pump.
 How to sketch a graph of a function using calculus only (Part 3)
 Graph the function by hand & label key points on graph:
 The original Supply and Demand graph
 The forked-line method for determining gamete genotype frequency