This topic contains a solution. Click here to go to the answer
|
|
|

 Students in class
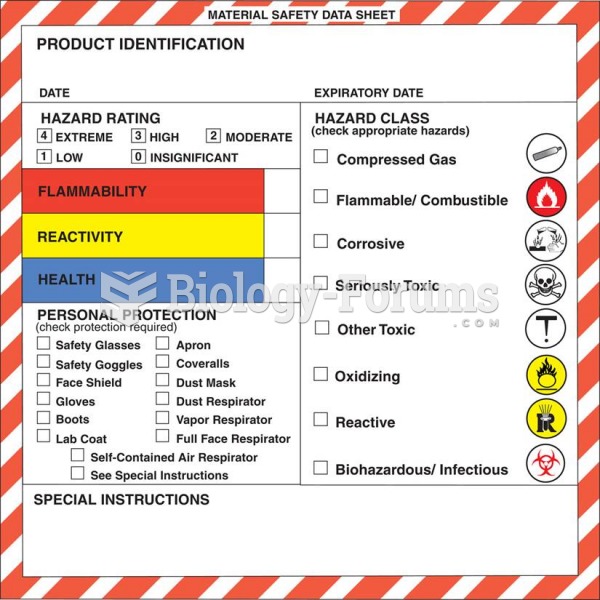 An example of a Material Safety Data Sheet (MSDS).
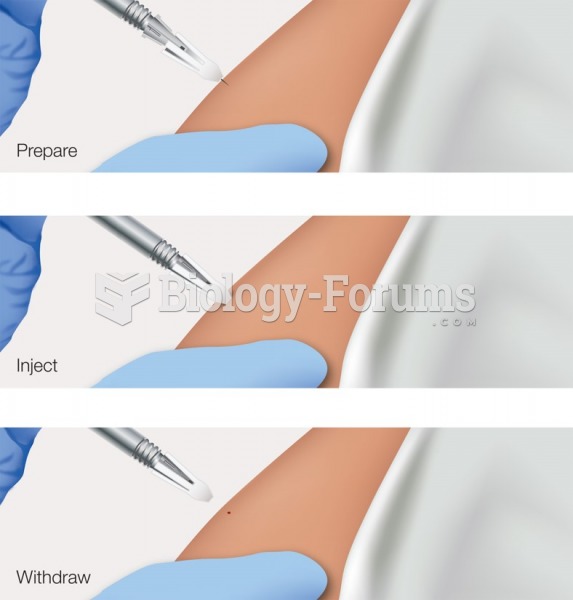 One type of safety needle withdraws into a protective sheath when the injection is complete.
 Stressing that education reproduces a country’s social class system, conflict theorists point out ...
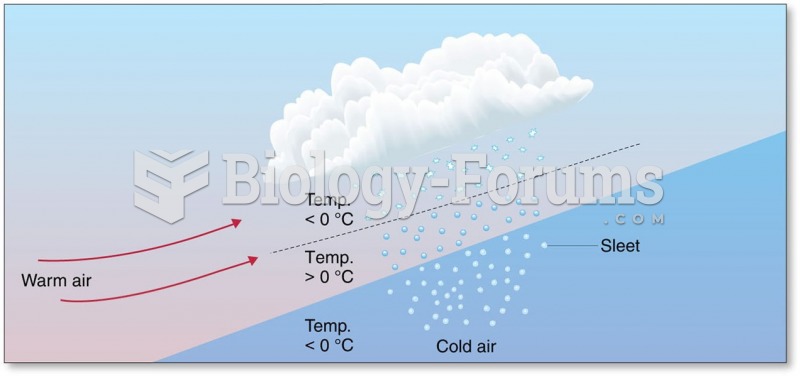 Distribution and Forms of Precipitation: Sleet
 Data Used to Analyze Productivity in Country 1 and Country 2