This topic contains a solution. Click here to go to the answer
|
|
|

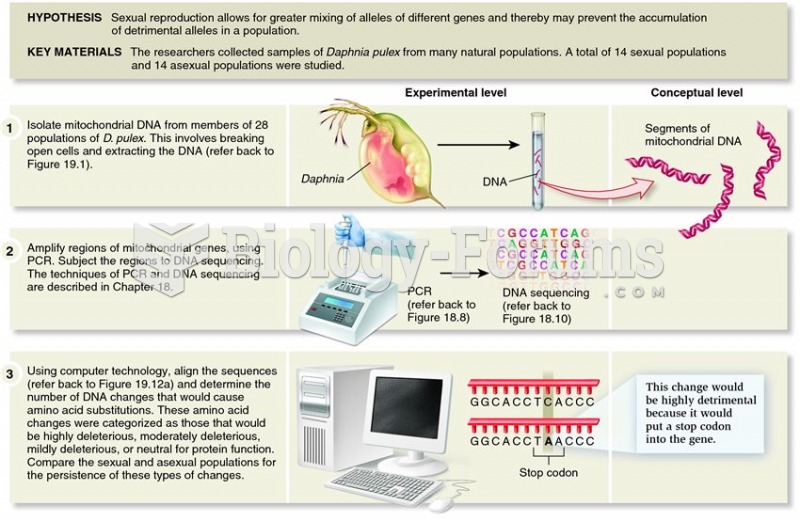 Paland and Lynch demonstrated the importance of sexual reproduction in reducing the frequency of mal
 Variable Gases: Water Vapor
 Graph the function by hand & label key points on graph:
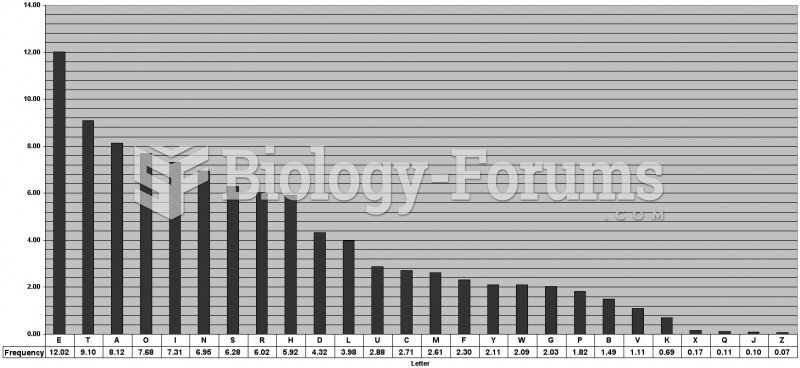 Letter Frequency Table
 The forked-line method for determining gamete genotype frequency
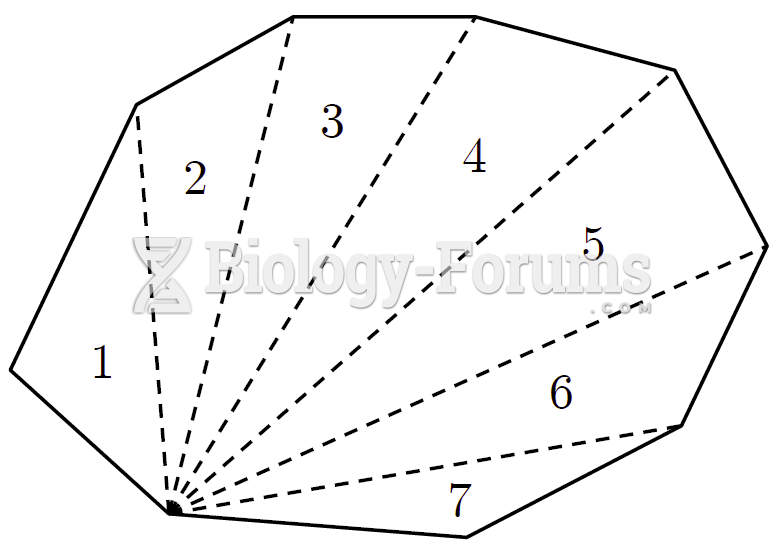 Approximation a polygon with triangles