This topic contains a solution. Click here to go to the answer
|
|
|

 The asymmetrical appearance of Mira, an oscillating variable star.
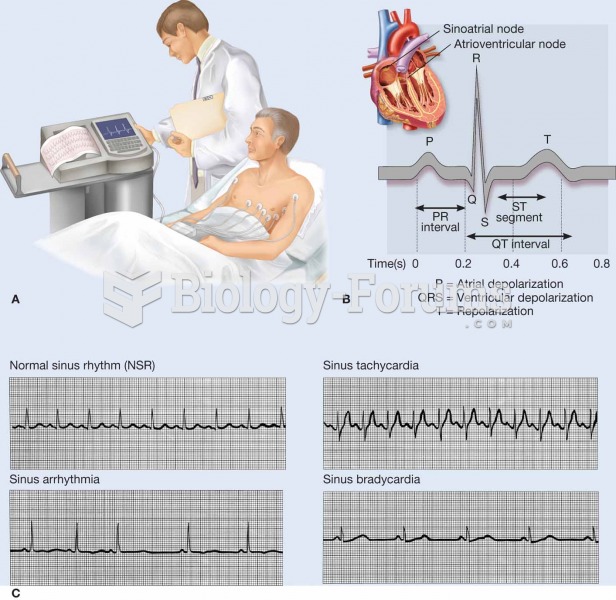 An electrocardiogram (ECG, EKG) is a commonly used procedure in which the electrical events associat
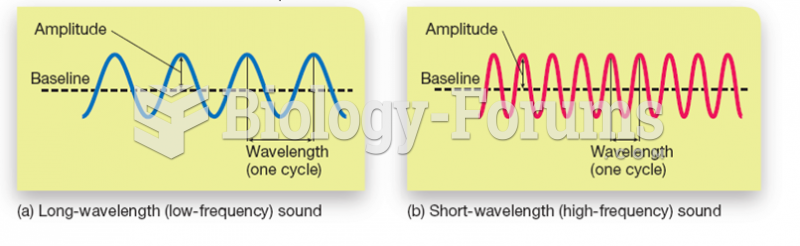 Characteristics of Sound: Frequency and Amplitude
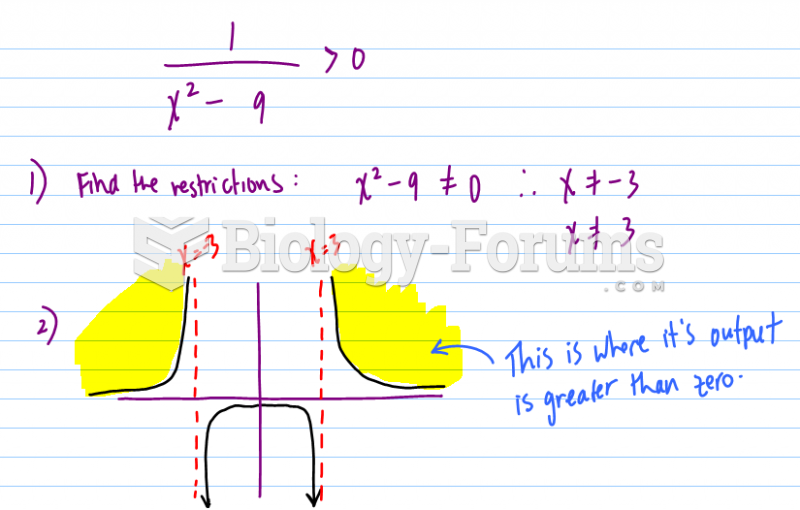 To satisfy the inequality, sketch the following function by hand and shade the graph regions.
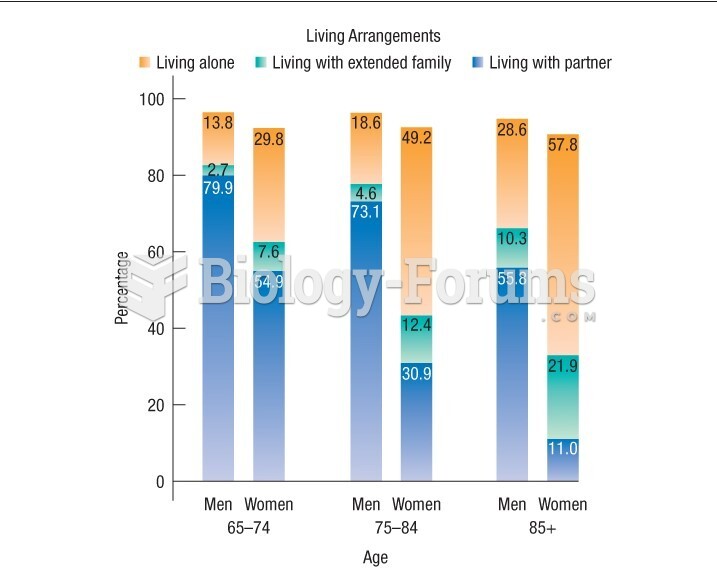 Graph shows the living arrangements of Canadian seniors
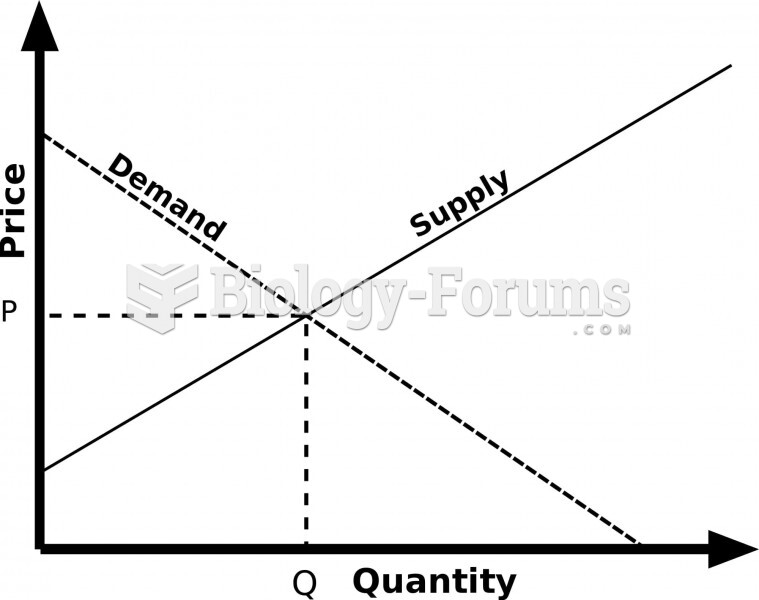 The original Supply and Demand graph