This topic contains a solution. Click here to go to the answer
|
|
|

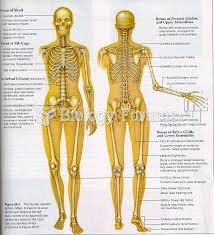 Human Skeleton Diagram
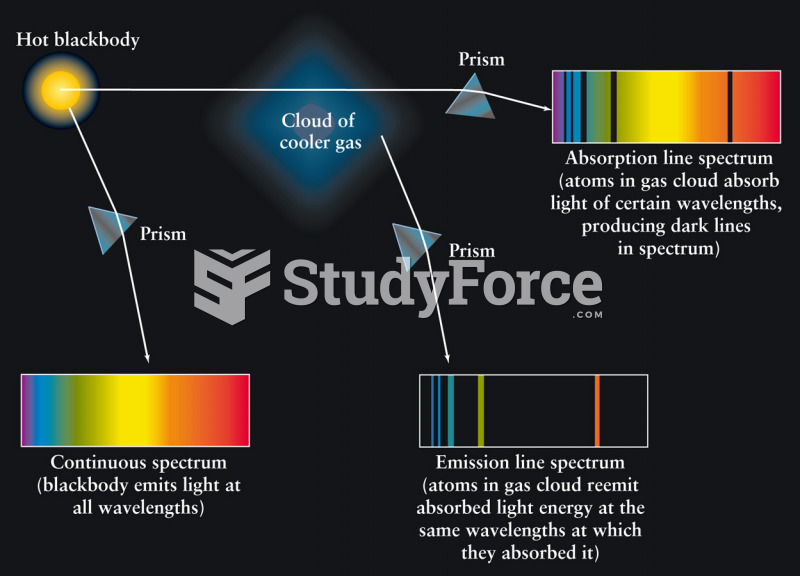 Continuous, Absorption Line, and Emission Line Spectra
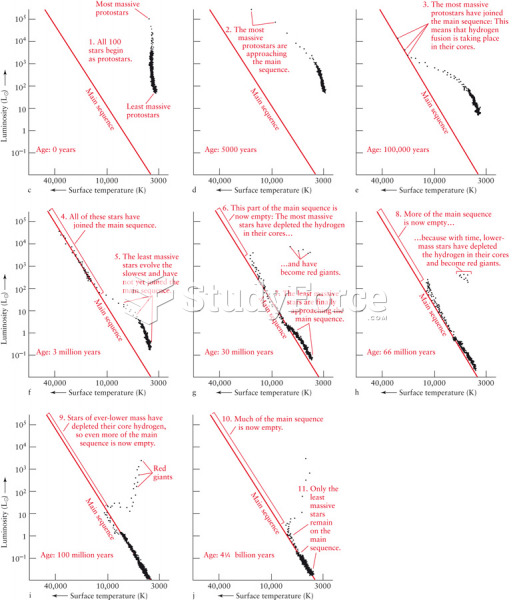 Structure of the H-R Diagram
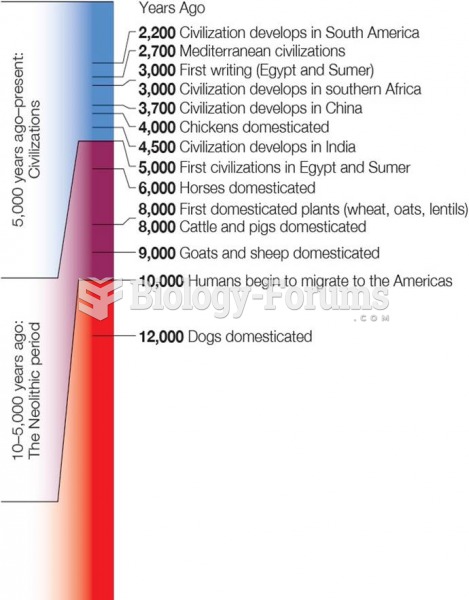 Time Line of Human History From Upper Paleolithic Period to the Present
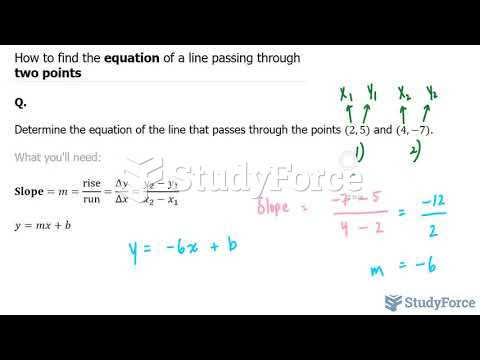 How to find the equation of a line passing through two points
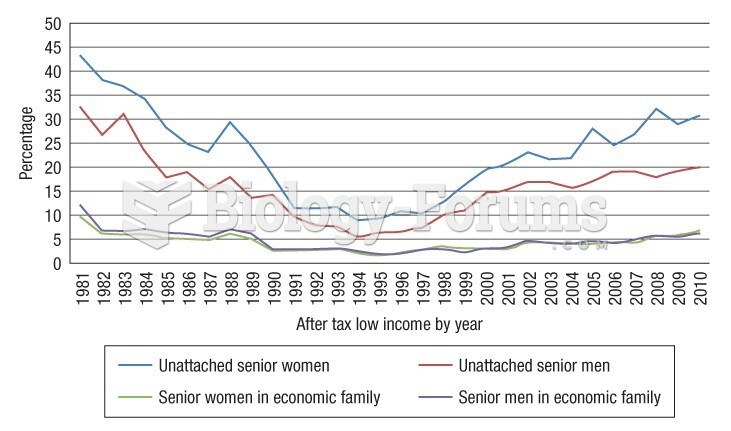 This graph illustrates how unattached older adults are poorer than their peers who live in families