This topic contains a solution. Click here to go to the answer
|
|
|

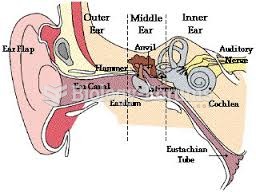 Human Ear diagram
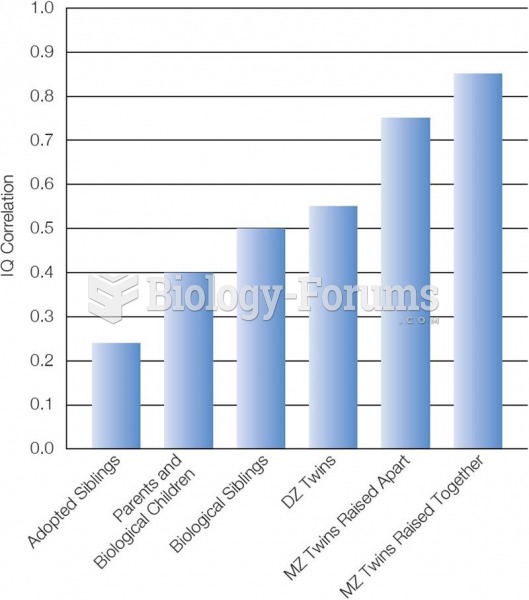 IQ and Genetics The closer the genetic relationship, the higher the correlation in IQ. Based on: Br
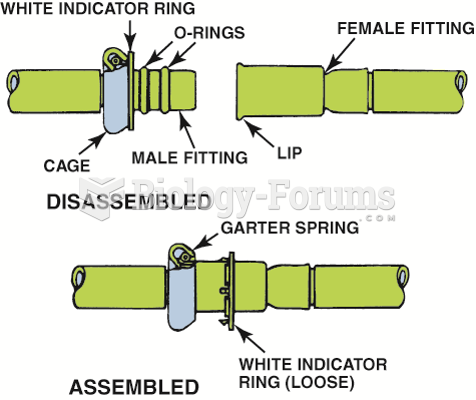 Some Ford metal line connections use springlocks and O-rings.
 Gently squeeze the tissues along the eyebrow line between your thumb and forefinger. Begin at the ...
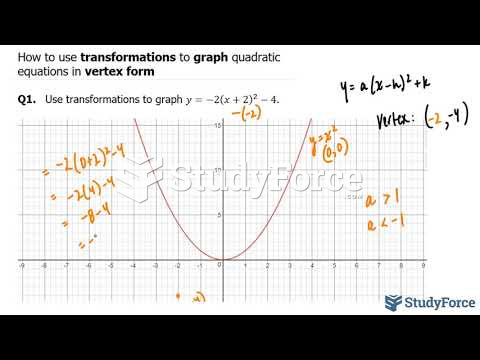 How to use transformations to graph quadratic equations in vertex form
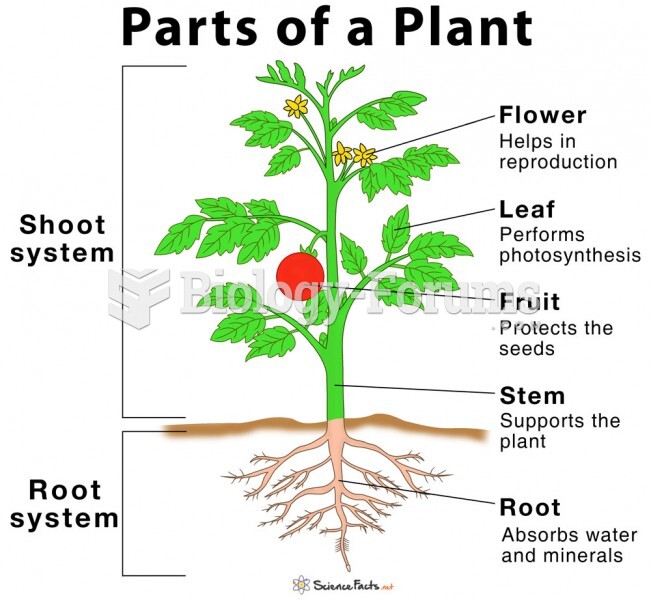 diagram of a plant