This topic contains a solution. Click here to go to the answer
|
|
|

 Uranus's aurorae against its equatorial rings, imaged by the Hubble telescope. Unlike the auror
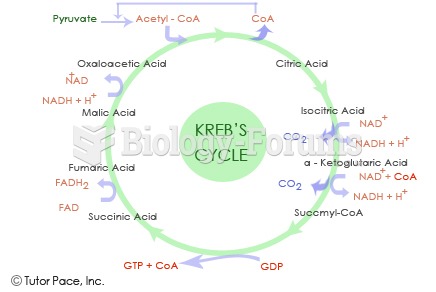 Krebs Cycle Diagram
 Three days after the Boston Marathon explosion, the FBI released this photograph that had been taken
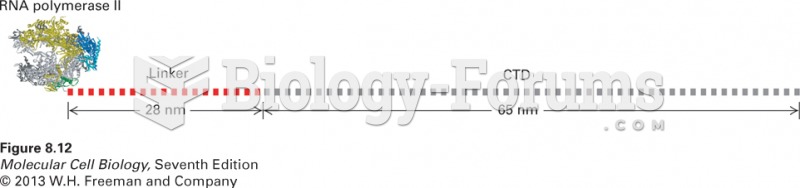 Schematic diagram of RNA polymerase II with the CTD extended
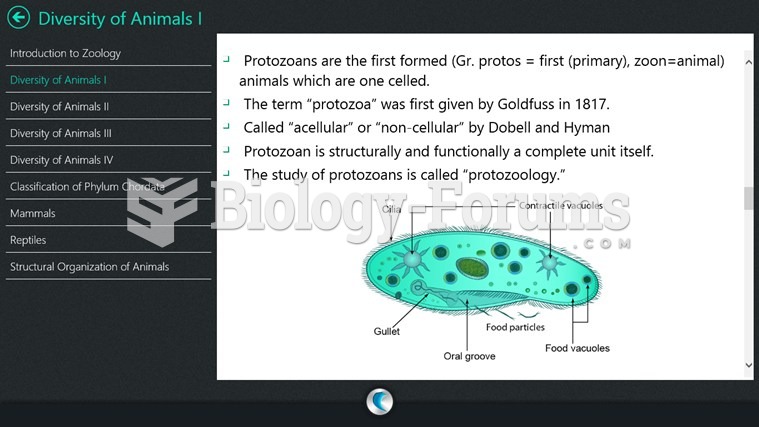 diagram
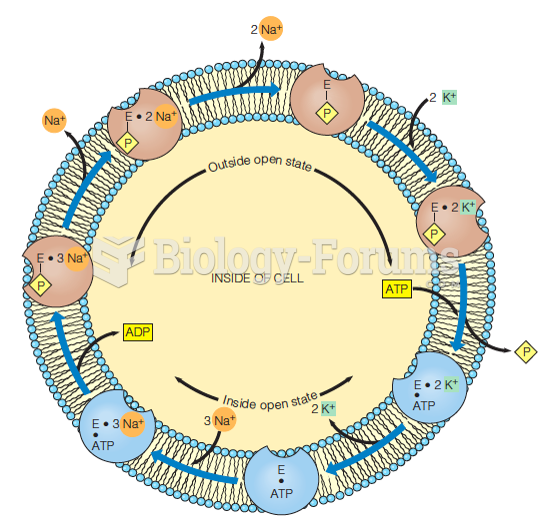 A schematic diagram of the functional cycle of the Na+–K+ pump