|
|
|

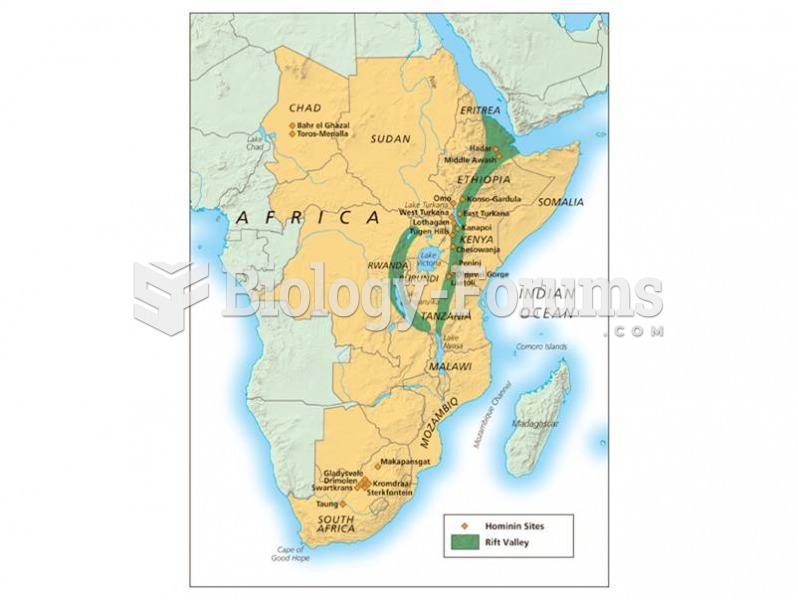 Geographic distribution of early hominins.
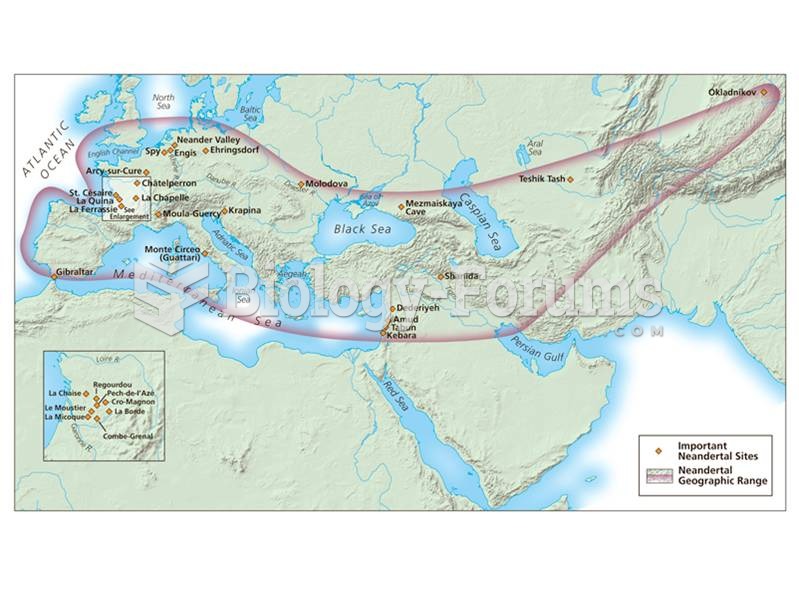 Distribution of Neandertal sites in Europe and western Asia.
 Government By the People, 2016 Presidential Election, 26th Edition
 Plot showing the number of genes on each human chromosome
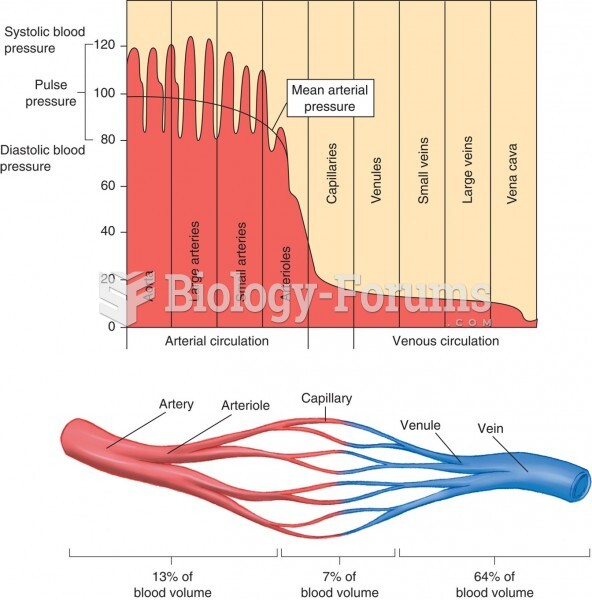 Vascular Distribution and Control of Circulation
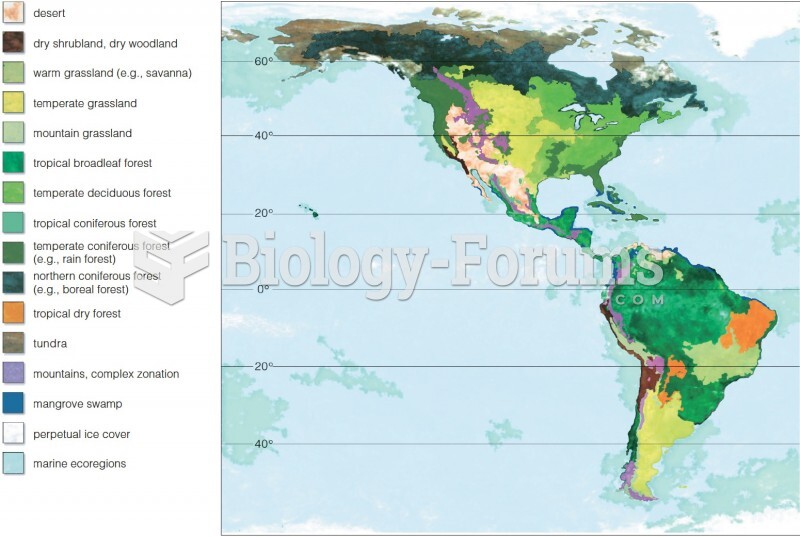 Global Distribution of Biomes