|
|
|

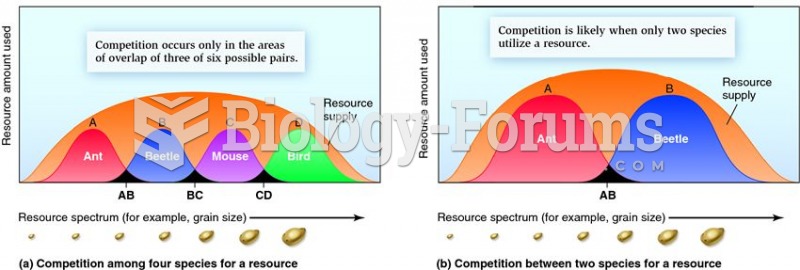 The frequency of competition according to the number of species involved.
 Upward social mobility, though welcome, can place people in a world so different from their world of ...
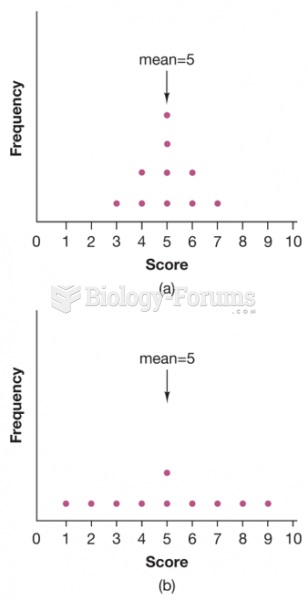 . In which distribution is the mean more “typical” of all scores?
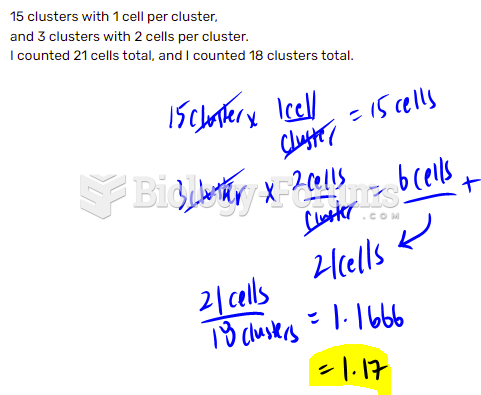 What would your average (mean) number of cells per cluster be?
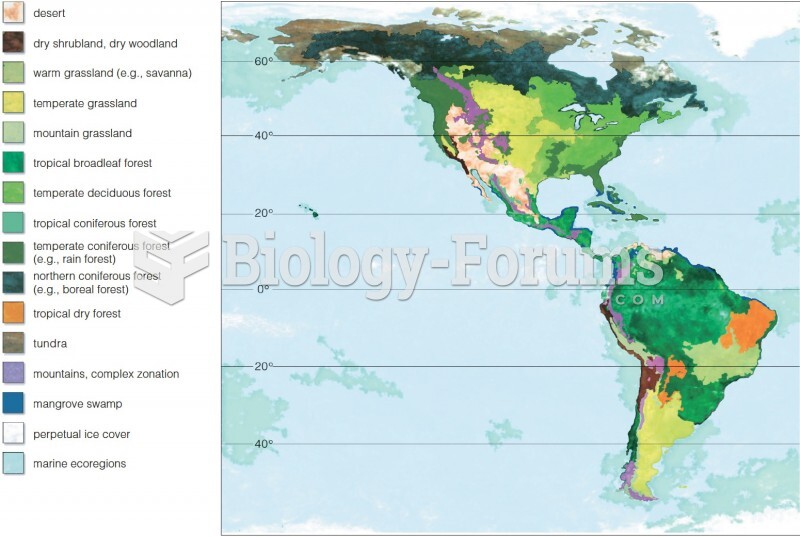 Global Distribution of Biomes
 Number line (real numbers)