|
|
|

 Earth Affects People; People Change Earth
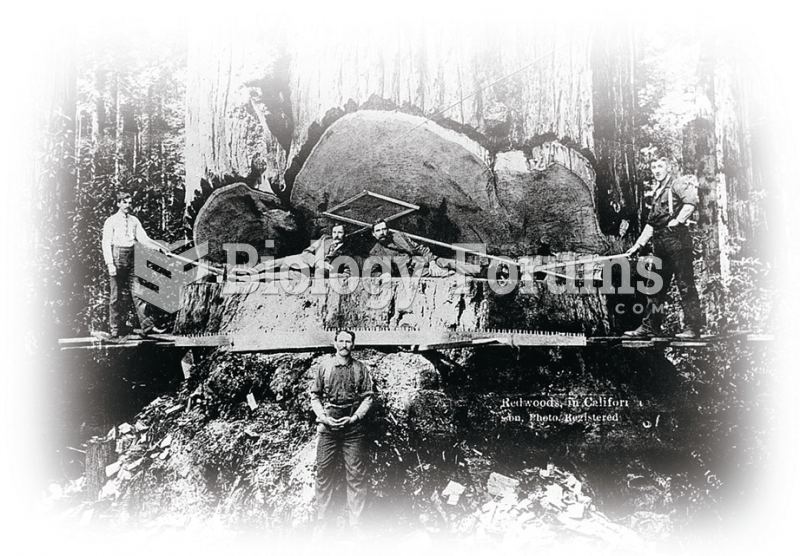 Values, both those held by individuals and those that represent a nation or people, can undergo deep ...
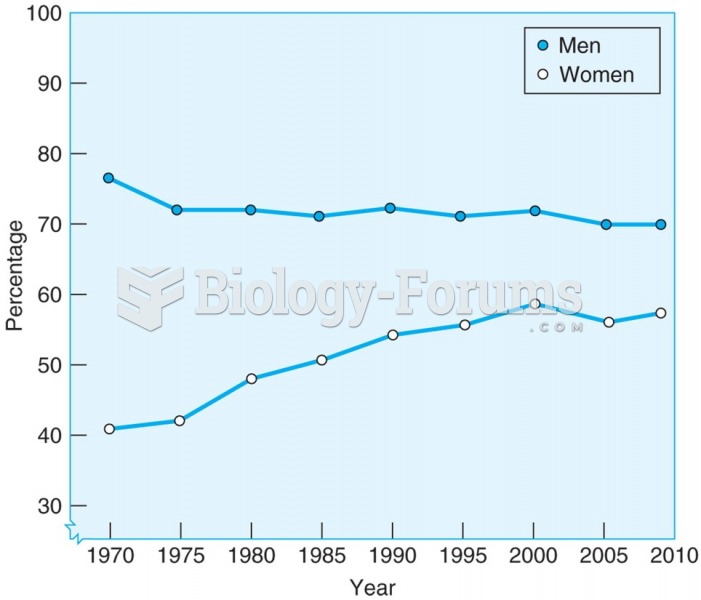 A greater number of men than women hold full-time jobs, but the gap is closing because of an ...
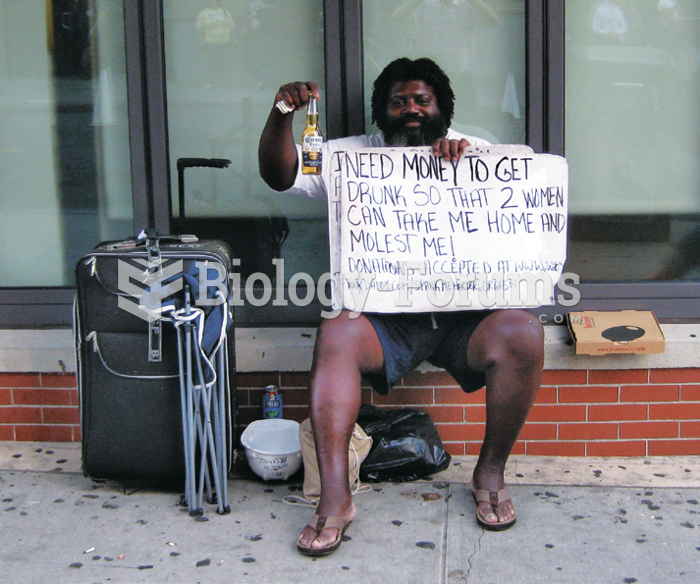 With tough economic times, a lot of people have lost their jobs—and their homes. If this happens, ...
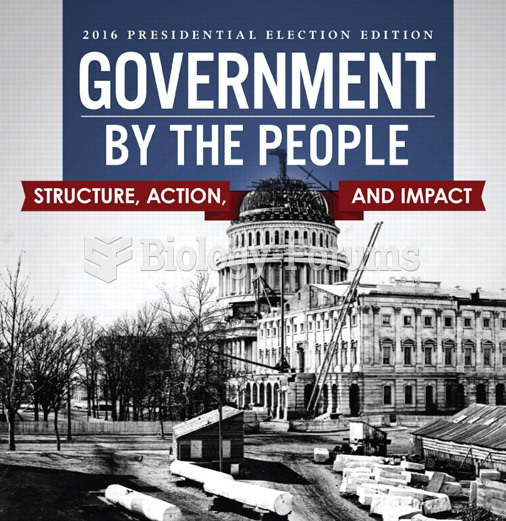 Government By the People, 2016 Presidential Election, 26th Edition
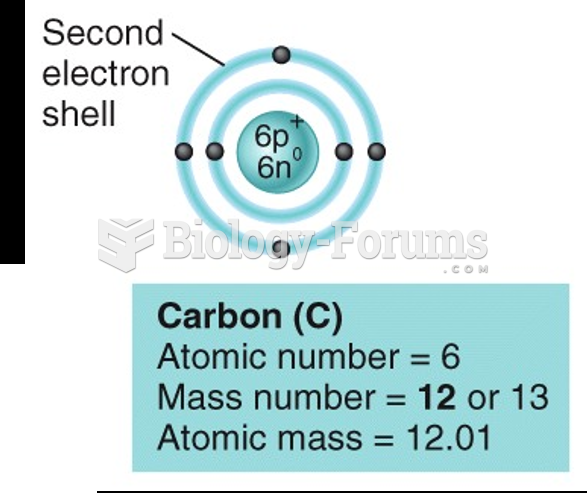 Atomic Number and Mass Number