This topic contains a solution. Click here to go to the answer
|
|
|

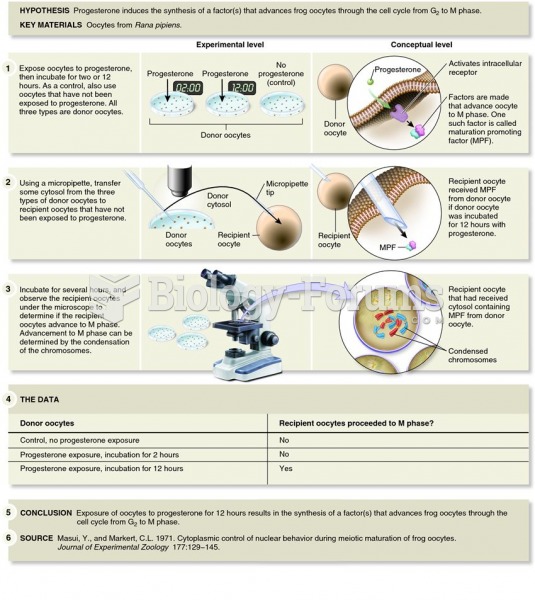 The experimental approach used by Masui and Markert to identify cyclin and cyclin-dependent kinase (
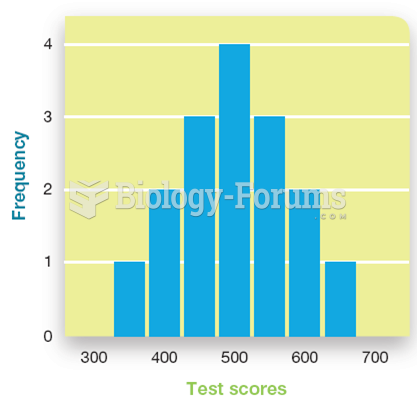 Graphing Psychological Data
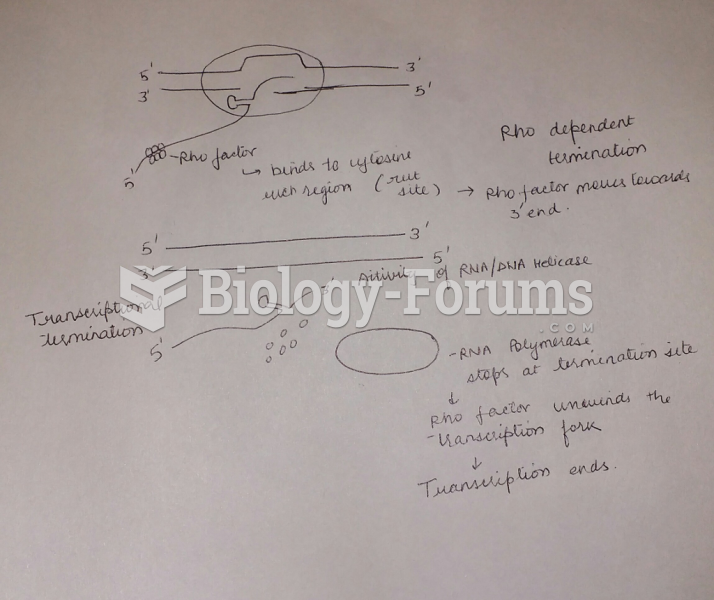 Draw and label a diagram and explain how a factor-dependent transcription (rho-dependent) terminator
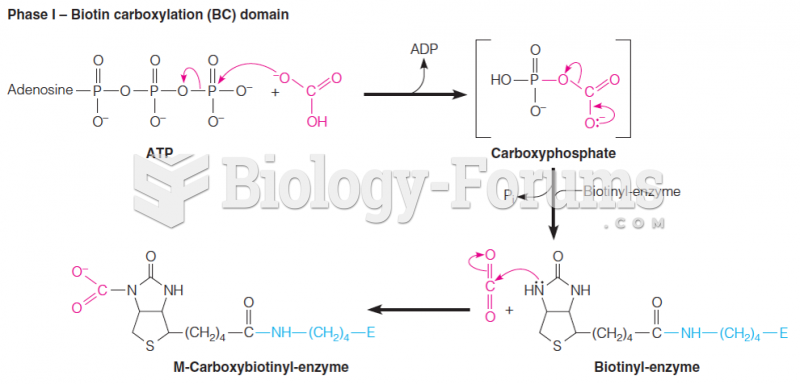 Mechanism of the biotin-dependent pyruvate carboxylase reaction Phase I
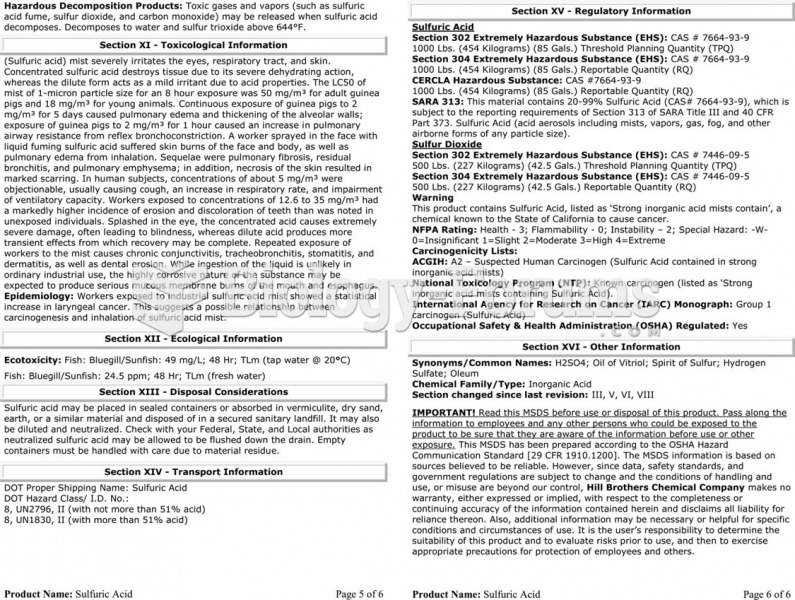 The material safety data sheet (MSDS) for sulfuric acid showing the detailed technical information ...
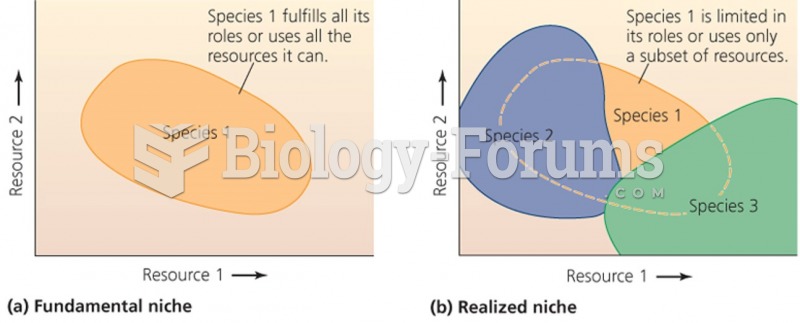 Niche: An individual’s ecological role