This topic contains a solution. Click here to go to the answer
|
|
|

 Acromegaly in one individual from a pair of identical twins.
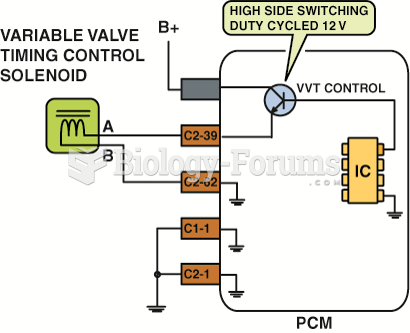 A variable valve timing solenoid being controlled by applying voltage from the PCM.
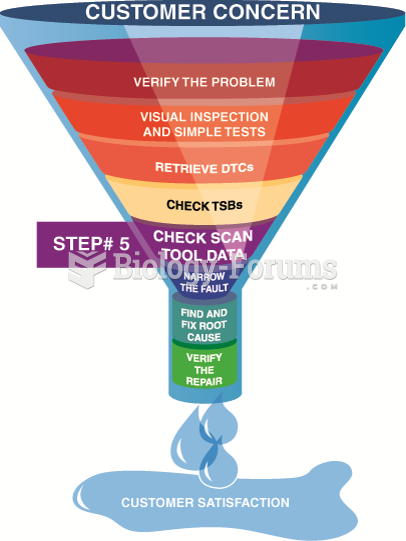 Looking carefully at the scan tool data is very helpful in locating the source of a problem.
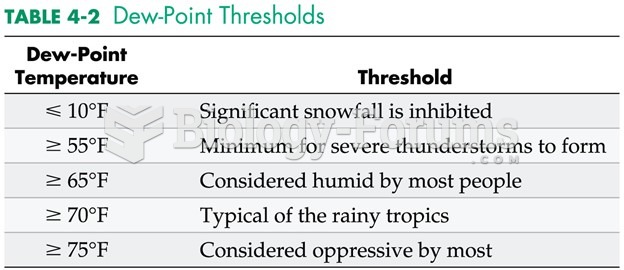 Dew-Point Thresholds
 Write the equation in general form of the line passing through the point
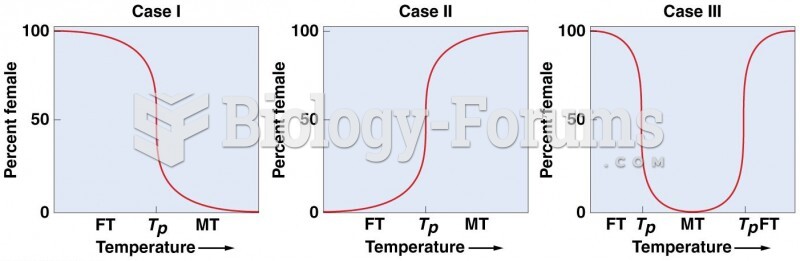 Three different patterns of temperature-dependent sex determination (TSD) in reptiles