This topic contains a solution. Click here to go to the answer
|
|
|

 Deviation of Normal Posture
 Tonsils—normal and enlarged.
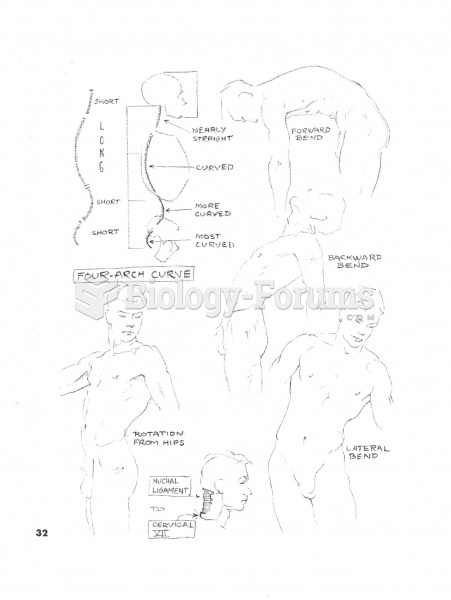 Four Arch Curve
 Stereotypes, which play such a profound role in social life, are a basic area of sociological ...
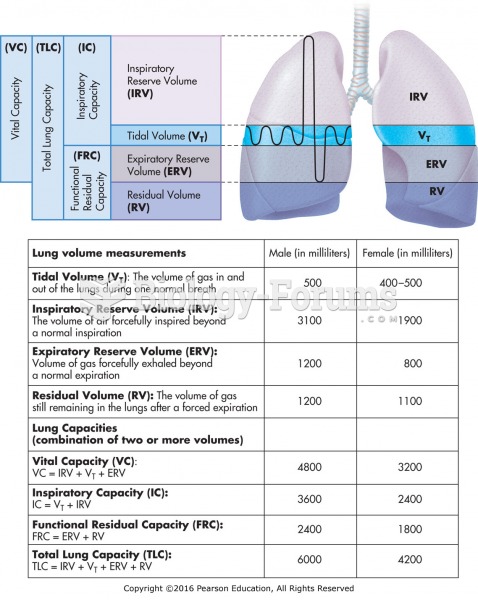 Normal lung volumes and capacities.
 A typical ECT sensor temperature versus voltage curve.