This topic contains a solution. Click here to go to the answer
|
|
|

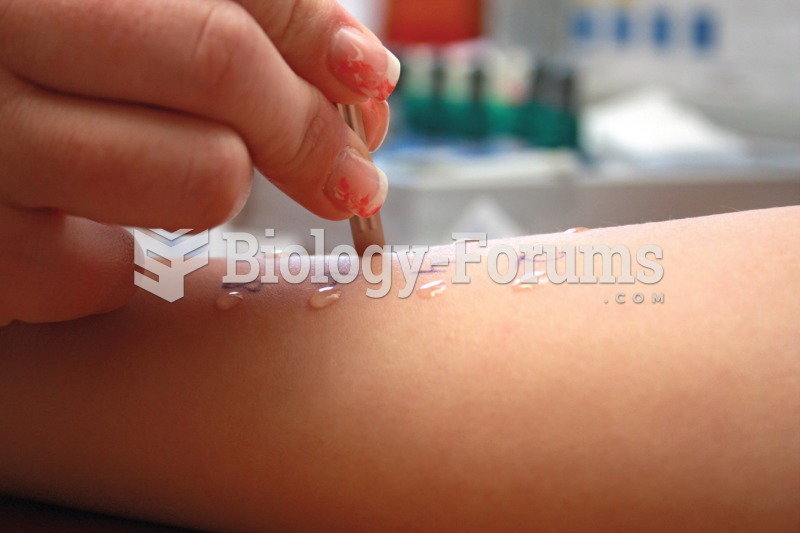 The patient is undergoing an allergy skin test by receiving subdermal inoculations of allergens. Inf
 How to create a sine equation when the curve is given
 Normal DNA vs Italian DNA
 The slope of the curve y = ax^3 - bx^2 + cx - 3 at x = 2 is 5. If the point of inflection of the cur
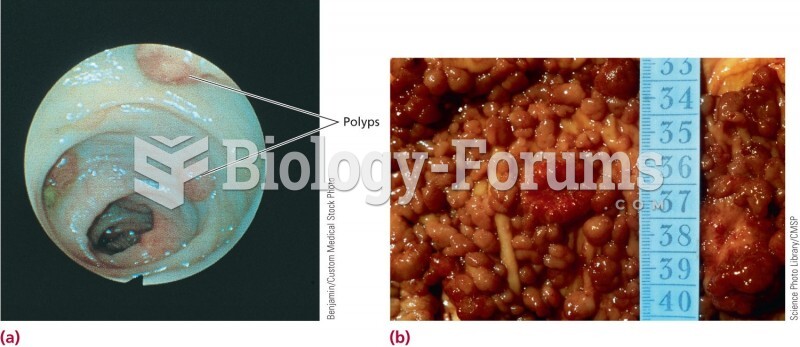 An endoscopic view of the colon of someone who carries the normal alleles for the APC gene
 Construct a Lorenz curve that shows income distribution in this society.