Did you know?
Hyperthyroidism leads to an increased rate of metabolism and affects about 1% of women but only 0.1% of men. For most people, this increased metabolic rate causes the thyroid gland to become enlarged (known as a goiter).
Did you know?
As the western states of America were settled, pioneers often had to drink rancid water from ponds and other sources. This often resulted in chronic diarrhea, causing many cases of dehydration and death that could have been avoided if clean water had been available.
Did you know?
Tobacco depletes the body of vitamins A, C, and E, which can result in any of the following: dry hair, dry skin, dry eyes, poor growth, night blindness, abscesses, insomnia, fatigue, reproductive system problems, sinusitis, pneumonia, frequent respiratory problems, skin disorders, weight loss, rickets, osteomalacia, nervousness, muscle spasms, leg cramps, extremity numbness, bone malformations, decayed teeth, difficulty in walking, irritability, restlessness, profuse sweating, increased uric acid (gout), joint damage, damaged red blood cells, destruction of nerves, infertility, miscarriage, and many types of cancer.
Did you know?
Adolescents often feel clumsy during puberty because during this time of development, their hands and feet grow faster than their arms and legs do. The body is therefore out of proportion. One out of five adolescents actually experiences growing pains during this period.
Did you know?
Stroke kills people from all ethnic backgrounds, but the people at highest risk for fatal strokes are: black men, black women, Asian men, white men, and white women.

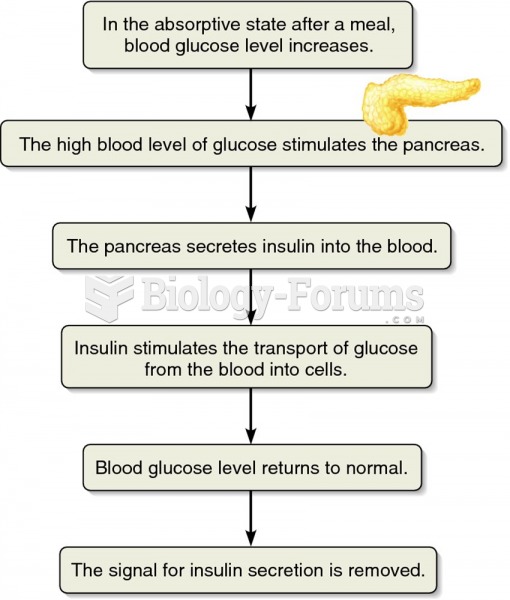 Maintenance of normal blood glucose levels.
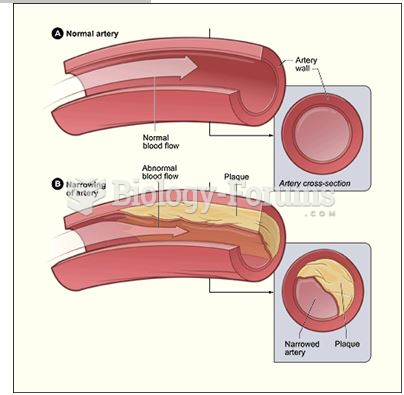 Normal artery versus plaque formation
 Normal Distribution of IQ Scores
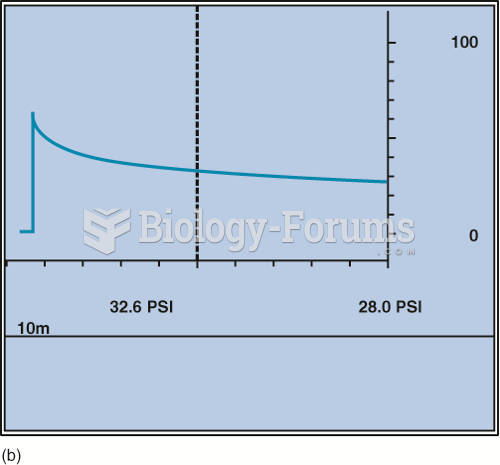 Pressure drop after 10 minutes on a normal port fuel-injection system.
 How to determine if a table of values represents a linear or quadratic relationship
 Normal and Impaired Vision